Among the San Francisco condo sales in this analysis, the median monthly HOA payment rose 45% from 2020 to 2026. Dues per square foot rose 55%, while sale prices per square foot rose about 1%.
My read: HOA dues deserve a central place in a condo comparison because they change the monthly cost of ownership. Between the first ten months of 2020 and the first ten months of 2026, the median HOA payment on a closed SFAR condo sale went from $570 to $825 a month. Measured per square foot, dues rose 55%. Median price per square foot rose about 1% over the same stretch. The share of condo sales carrying $1,000 or more in monthly dues went from 12% to 36%.
That gap matters more at today's rates. Freddie Mac's 30-year fixed averaged 7.18% the week of November 5. At that rate, every $100 a month in dues uses roughly the same monthly budget as $14,800 of mortgage. A $300 monthly dues difference therefore uses the same principal-and-interest budget as about $44,000 of mortgage debt. This is a payment comparison, not a measured price discount or a change in purchase-price capacity, which also depends on down payment, taxes, insurance and lending criteria.
1. Dues outran prices for six straight years
Condo dues per sq ft rose 55% since 2020. Price per sq ft rose 1%.
View chart data
| year | n_sales | median_monthly_hoa | median_hoa_per_sqft | median_price_per_sqft | dues_index_2020_100 | price_index_2020_100 | share_hoa_1000_plus |
|---|---|---|---|---|---|---|---|
| 2020 | 1374 | 569.5 | 0.5533 | 1104.6 | 100.0 | 100.0 | 0.116 |
| 2021 | 2504 | 607.5 | 0.6055 | 1096.9 | 109.4 | 99.3 | 0.138 |
| 2022 | 1920 | 635.0 | 0.6129 | 1090.7 | 110.8 | 98.7 | 0.16 |
| 2023 | 1243 | 663.0 | 0.6639 | 997.9 | 120.0 | 90.3 | 0.207 |
| 2024 | 1385 | 712.0 | 0.7071 | 998.8 | 127.8 | 90.4 | 0.247 |
| 2025 | 1506 | 782.5 | 0.8012 | 991.1 | 144.8 | 89.7 | 0.316 |
| 2026 | 1703 | 825.0 | 0.8549 | 1116.5 | 154.5 | 101.1 | 0.357 |
Dues per square foot rose every single year in this data, including 2023 and 2024 when condo prices per square foot fell about 9% from their 2022 level. Prices finally recovered in 2026, with median price per square foot up about 13% from 2025, but that recovery only brought prices back to where they were in 2020. Dues never paused.
2. This is not just a mix shift: the same buildings got more expensive to own
A fair objection to chart 1 is composition. If more sales are coming from full-service towers, median dues rise even if no building raised its dues. So I matched buildings: 653 San Francisco condo buildings (by location) that had sales in both 2020 to 2021 and 2025 to 2026, covering 3,381 sales.
In the same buildings, dues rose 27% while price per sq ft fell 6%
View chart data
| comparison | n_sales_or_buildings | hoa_per_sqft_change_pct | price_per_sqft_change_pct | detail |
|---|---|---|---|---|
| All condo sales | 4830 (2020-21) / 3497 (2025-26) | 40.7 | -4.2 | HOA/sqft 0.5827 to 0.8201; $/sqft 1089.7 to 1043.9 |
| Same buildings | 653 buildings / 3381 sales | 26.6 | -6.0 | median of building-level changes; 52% of buildings up >25%, 12% down |
Inside the same buildings, the median dues per square foot rose 27%, while the median price per square foot in those same buildings fell 6%. About half of the matched buildings (52%) raised dues per square foot by more than 25%; only 12% came down. The citywide increase was 41% between the two periods. The matched-building result shows that the increase was not solely a shift toward higher-dues buildings. Comparing these different medians does not establish how much of the citywide change came from dues increases versus the mix of sales.
The data does not say why dues rose. The usual drivers are insurance renewals, reserve funding, labor and utilities, and deferred maintenance coming due. Those vary building by building, which is exactly why the budget and reserve study matter more than the headline number.
3. The buildings behind the numbers
To put names on this, I pulled every San Francisco condo building with at least eight sales in 2020 to 2021 and at least eight in 2025 to 2026. That gives 44 buildings and 1,657 sales, mostly the towers and mid-rises in South of Market, Rincon Hill, Mission Bay, Nob Hill and Cathedral Hill. Two numbers sum it up: 41 of the 44 raised dues per square foot (median +26%), and 37 of the 44 saw median price per square foot fall (median -10%).
In 15 of the 44 buildings, dues per sq ft rose 35% to 74%
View chart data
Click a column header to sort.
| building | address | n_2020_21 | n_2025_26 | fewer_than_10_sales_in_a_period | hoa_psf_2020_21 | hoa_psf_2025_26 | hoa_psf_change_pct | dollar_change_per_month_per_1000_sqft | median_monthly_hoa_2020_21 | median_monthly_hoa_2025_26 | median_monthly_hoa_change_dollars_unadjusted |
|---|---|---|---|---|---|---|---|---|---|---|---|
| Yerba Buena Lofts | 855 Folsom St | 11 | 8 | yes | 0.659 | 1.146 | 73.9 | 487 | 633 | 908.5 | 275.5 |
| Clocktower Lofts | 461 2nd St | 9 | 9 | yes | 0.606 | 1.048 | 72.9 | 442 | 726 | 924 | 198 |
| Daniel Burnham Court | 1 Daniel Burnham Ct | 18 | 8 | yes | 1.043 | 1.741 | 66.9 | 698 | 801 | 1306 | 505 |
| Fillmore Heritage | 1310 Fillmore St | 12 | 8 | yes | 0.74 | 1.223 | 65.3 | 483 | 851.5 | 973 | 121.5 |
| Bridgeview | 400 Beale St | 21 | 13 | no | 0.946 | 1.497 | 58.2 | 551 | 895 | 1221 | 326 |
| Brannan | 219 Brannan St | 15 | 9 | yes | 1.045 | 1.569 | 50.1 | 524 | 1204 | 1685 | 481 |
| One Rincon Hill, Tower II | 401 Harrison St | 40 | 29 | no | 1.092 | 1.593 | 45.9 | 501 | 1318.5 | 1750 | 431.5 |
| 999 Green | 999 Green St | 9 | 12 | yes | 1.373 | 1.978 | 44.1 | 605 | 2245 | 2740 | 495 |
| The Metropolitan | 355 1st St | 19 | 8 | yes | 1.074 | 1.537 | 43.1 | 463 | 840 | 1127 | 287 |
| Gramercy Towers | 1177 California St | 17 | 14 | no | 1.613 | 2.256 | 39.9 | 643 | 1139 | 1458.5 | 319.5 |
| Museum Parc | 300 3rd St | 11 | 15 | no | 0.77 | 1.048 | 36.1 | 278 | 766 | 909 | 143 |
| The Avery | 488 Folsom St | 11 | 23 | no | 0.993 | 1.348 | 35.8 | 355 | 1819 | 2463 | 644 |
| Arden | 708 and 718 Long Bridge St | 39 | 21 | no | 0.861 | 1.166 | 35.4 | 305 | 1181 | 1599 | 418 |
| Opera Plaza | 601 Van Ness Ave | 37 | 41 | no | 1.306 | 1.761 | 34.8 | 455 | 940 | 1285 | 345 |
| 101 Lombard | 101 Lombard St | 10 | 16 | no | 0.945 | 1.273 | 34.7 | 328 | 1248 | 1593 | 345 |
| 199 New Montgomery | 199 New Montgomery St | 11 | 9 | yes | 0.73 | 0.98 | 34.2 | 250 | 621 | 863 | 242 |
| One Rincon Hill, Tower I | 425 1st St | 33 | 32 | no | 1.301 | 1.744 | 34.1 | 443 | 1107 | 1557 | 450 |
| Baycrest | 201 Harrison St | 30 | 8 | yes | 1.102 | 1.47 | 33.4 | 368 | 668 | 866 | 198 |
| One Embarcadero South | 88 King St | 23 | 15 | no | 0.945 | 1.261 | 33.4 | 316 | 1127 | 1496 | 369 |
| The Infinity | 301 Main and 338 Spear St | 26 | 27 | no | 0.807 | 1.074 | 33.1 | 267 | 989 | 1309 | 320 |
| La Galleria | 900 Bush St | 23 | 9 | yes | 1.515 | 1.942 | 28.2 | 427 | 1058 | 1332 | 274 |
| The Beacon | 250 and 260 King St | 70 | 40 | no | 0.94 | 1.199 | 27.6 | 259 | 850 | 1028 | 178 |
| Watermark | 501 Beale St | 12 | 10 | no | 1.071 | 1.341 | 25.2 | 270 | 1091 | 1403.5 | 312.5 |
| Millennium Tower | 301 Mission St | 19 | 32 | no | 1.584 | 1.975 | 24.7 | 391 | 1986 | 2288 | 302 |
| Cathedral Hill Tower | 1200 Gough St | 11 | 11 | no | 0.956 | 1.185 | 24.0 | 229 | 831 | 1180 | 349 |
| One Hawthorne | 1 Hawthorne St | 11 | 15 | no | 1.019 | 1.257 | 23.4 | 238 | 1220 | 1448 | 228 |
| Arterra | 300 Berry St | 17 | 15 | no | 0.801 | 0.982 | 22.6 | 181 | 592 | 803 | 211 |
| The Palms | 555 4th St | 44 | 18 | no | 0.845 | 1.018 | 20.5 | 173 | 650.5 | 755.5 | 105.0 |
| The Hamilton | 631 O'Farrell St | 14 | 12 | no | 1.363 | 1.635 | 20.0 | 272 | 709 | 850 | 141 |
| The Austin | 1545 Pine St | 10 | 12 | no | 1.158 | 1.388 | 19.9 | 230 | 929 | 1261.5 | 332.5 |
| Lumina | 201 Folsom, 338 and 318 Main, 333 Beale | 71 | 53 | no | 0.905 | 1.075 | 18.8 | 170 | 1215 | 1407 | 192 |
| 950 Tennessee | 950 Tennessee St | 15 | 11 | no | 0.684 | 0.797 | 16.5 | 113 | 544 | 910 | 366 |
| The Potrero | 451 Kansas St | 19 | 13 | no | 0.751 | 0.873 | 16.2 | 122 | 566 | 722 | 156 |
| Pine Terrace | 1001 Pine St | 20 | 13 | no | 0.879 | 1.016 | 15.6 | 137 | 573 | 697 | 124 |
| 1000 Third Street | 1000 3rd St | 17 | 14 | no | 0.779 | 0.895 | 14.9 | 116 | 928 | 1051 | 123 |
| The Hayes | 55 Page St | 12 | 12 | no | 0.753 | 0.859 | 14.1 | 106 | 560 | 686 | 126 |
| Sutterfield | 1483 Sutter St | 10 | 10 | no | 0.957 | 1.085 | 13.4 | 128 | 756 | 976.5 | 220.5 |
| SOMA Grand | 1160 Mission St | 16 | 13 | no | 1.041 | 1.174 | 12.8 | 133 | 787 | 1158 | 371 |
| 110 Channel | 110 Channel St | 13 | 13 | no | 0.984 | 1.088 | 10.6 | 104 | 828 | 906 | 78 |
| MIRA | 280 Spear St | 21 | 25 | no | 1.125 | 1.185 | 5.3 | 60 | 1181 | 1483 | 302 |
| The Rockwell | 1688 Pine St | 30 | 17 | no | 0.918 | 0.955 | 4.0 | 37 | 711.5 | 893 | 181.5 |
| The Lansing | 50 Lansing St | 10 | 8 | yes | 1.005 | 0.977 | -2.8 | -28 | 816 | 1064.5 | 248.5 |
| 555 Fulton | 555 Fulton St | 29 | 10 | no | 0.95 | 0.834 | -12.2 | -116 | 680 | 870 | 190 |
| 2177 Third | 2177 3rd St | 15 | 15 | no | 1.147 | 0.945 | -17.6 | -202 | 825 | 1290 | 465 |
Download the dues-increases chart · Download the supplied building dataset
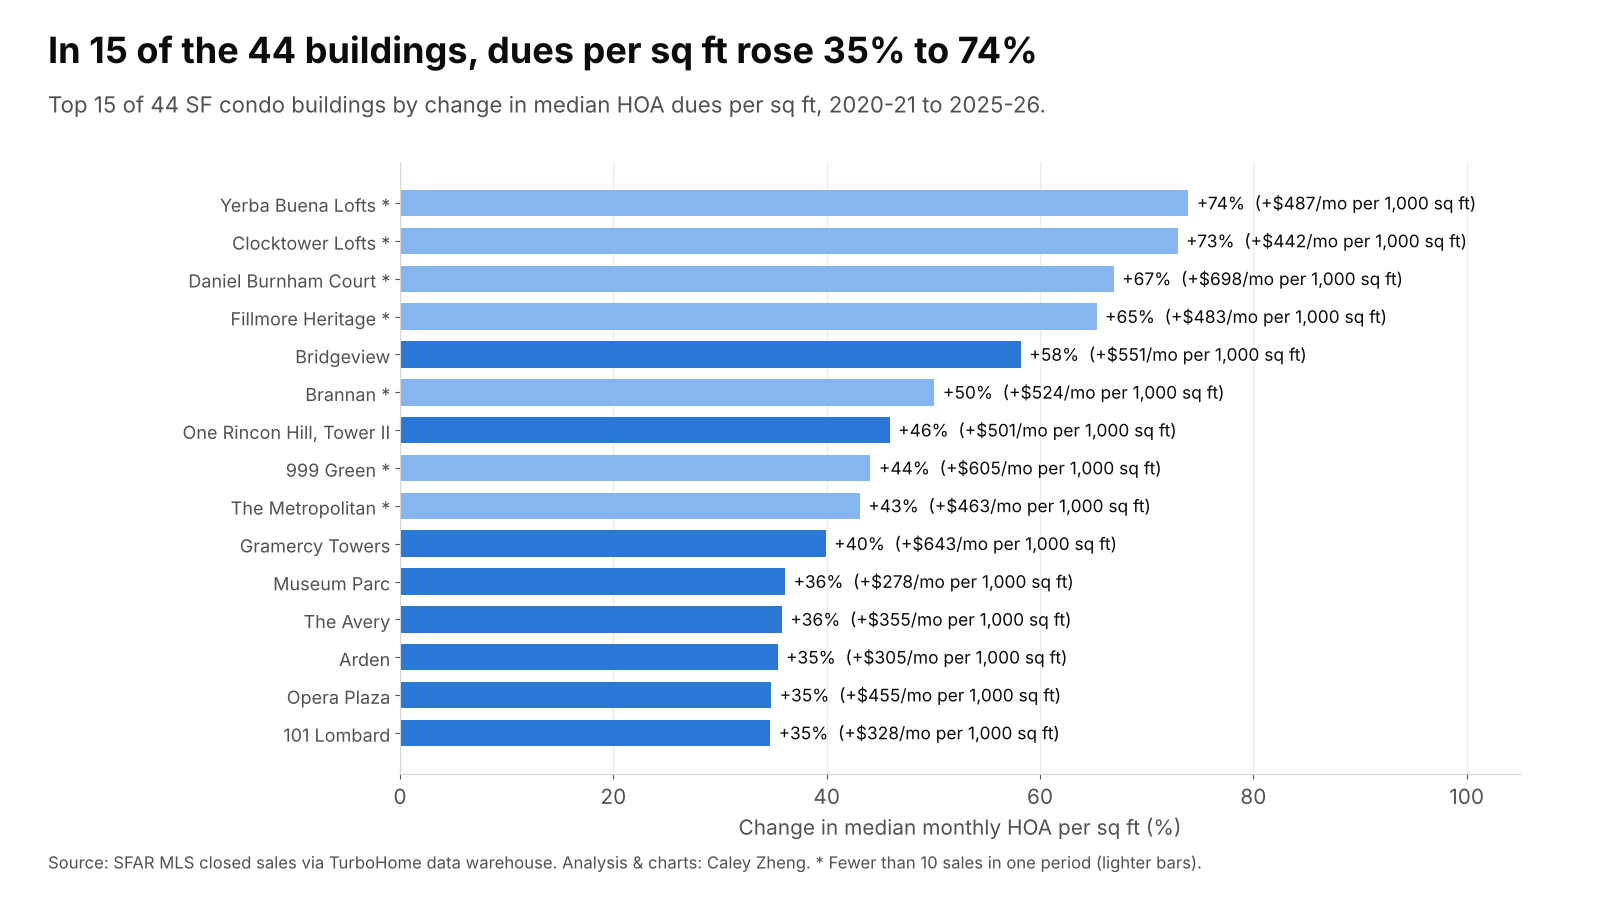
I rank the increases by dues per square foot, because the median monthly bill moves whenever a building sells more large or small units in one period (2177 Third's median bill rose $465 a month while its dues per square foot actually fell). The dollar labels apply each building's per-square-foot change to a 1,000 square foot unit. Among buildings with a solid number of sales in both periods, Bridgeview (400 Beale) leads at +58%, about $550 more a month for a 1,000 square foot unit, followed by One Rincon Hill Tower II (+46%, about $500), Gramercy Towers (+40%, about $640) and Opera Plaza (+35%, about $455). The top four on the list, Yerba Buena Lofts, Clocktower Lofts, Daniel Burnham Court and Fillmore Heritage, rose 65% to 74%, but each has fewer than 10 sales in one of the two periods, so I treat those as signals to check rather than settled numbers.
Higher current dues were associated with weaker price changes
View chart data
Click a column header to sort.
| building | address | neighborhood | year_built | n_2020_21 | n_2025_26 | median_hoa_2020_21 | median_hoa_2025_26 | hoa_psf_2020_21 | hoa_psf_2025_26 | hoa_psf_change_pct | price_psf_2020_21 | price_psf_2025_26 | price_psf_change_pct | sale_to_list_2025_26_pct | median_dom_2025_26 |
|---|---|---|---|---|---|---|---|---|---|---|---|---|---|---|---|
| Opera Plaza | 601 Van Ness Ave | Downtown / Civic Center | 1982 | 37 | 41 | 940 | 1285 | 1.306 | 1.761 | 34.8 | 827 | 674 | -18.5 | 97.9 | 55.5 |
| One Rincon Hill, Tower II | 401 Harrison St | South of Market | 2014 | 40 | 29 | 1318.5 | 1750 | 1.092 | 1.593 | 45.9 | 1457 | 1238 | -15.0 | 98.9 | 53 |
| One Rincon Hill, Tower I | 425 1st St | South of Market | 2008 | 33 | 32 | 1107 | 1557 | 1.301 | 1.744 | 34.1 | 1368 | 1194 | -12.7 | 96.2 | 29.5 |
| The Palms | 555 4th St | South of Market | 2006 | 44 | 18 | 650.5 | 755.5 | 0.845 | 1.018 | 20.5 | 1096 | 960 | -12.4 | 98.3 | 36 |
| The Beacon | 250 and 260 King St | South of Market | 2004 | 70 | 40 | 850 | 1028 | 0.94 | 1.199 | 27.6 | 950 | 844 | -11.2 | 99.0 | 32 |
| Millennium Tower | 301 Mission St | Financial District | 2009 | 19 | 32 | 1986 | 2288 | 1.584 | 1.975 | 24.7 | 1004 | 819 | -18.4 | 94.9 | 54 |
| The Rockwell | 1688 Pine St | Western Addition | 2016 | 30 | 17 | 711.5 | 893 | 0.918 | 0.955 | 4.0 | 1300 | 1224 | -5.8 | 100.0 | 18 |
| MIRA | 280 Spear St | Financial District | 2020 | 21 | 25 | 1181 | 1483 | 1.125 | 1.185 | 5.3 | 1321 | 1268 | -4.0 | 98.3 | 38 |
| Lumina | 201 Folsom, 338 and 318 Main, 333 Beale | South of Market | 2016 | 71 | 53 | 1215 | 1407 | 0.905 | 1.075 | 18.8 | 1327 | 1263 | -4.8 | 98.9 | 18.5 |
| 555 Fulton | 555 Fulton St | Western Addition | 2020 | 29 | 10 | 680 | 870 | 0.95 | 0.834 | -12.2 | 1195 | 1108 | -7.3 | 99.7 | 45.5 |
| Baycrest | 201 Harrison St | South of Market | 1991 | 30 | 8 | 668 | 866 | 1.102 | 1.47 | 33.4 | 1118 | 931 | -16.7 | 94.9 | 101 |
| One Embarcadero South | 88 King St | South of Market | 2000 | 23 | 15 | 1127 | 1496 | 0.945 | 1.261 | 33.4 | 1118 | 1039 | -7.1 | 99.3 | 24 |
| Arden | 708 and 718 Long Bridge St | South of Market | 2016 | 39 | 21 | 1181 | 1599 | 0.861 | 1.166 | 35.4 | 1313 | 1360 | 3.6 | 101.2 | 12 |
| The Avery | 488 Folsom St | Financial District | 2019 | 11 | 23 | 1819 | 2463 | 0.993 | 1.348 | 35.8 | 1856 | 1960 | 5.6 | 98.6 | 43 |
| Bridgeview | 400 Beale St | South of Market | 2002 | 21 | 13 | 895 | 1221 | 0.946 | 1.497 | 58.2 | 1040 | 889 | -14.5 | 95.6 | 85 |
| Pine Terrace | 1001 Pine St | Nob Hill | 1963 | 20 | 13 | 573 | 697 | 0.879 | 1.016 | 15.6 | 1152 | 962 | -16.5 | 100.0 | 37 |
| The Potrero | 451 Kansas St | Potrero Hill | 2007 | 19 | 13 | 566 | 722 | 0.751 | 0.873 | 16.2 | 1204 | 1107 | -8.1 | 101.3 | 20 |
| The Infinity | 301 Main and 338 Spear St | South of Market | 2008 | 26 | 27 | 989 | 1309 | 0.807 | 1.074 | 33.1 | 1224 | 1179 | -3.7 | 97.1 | 37 |
| La Galleria | 900 Bush St | Nob Hill | 1982 | 23 | 9 | 1058 | 1332 | 1.515 | 1.942 | 28.2 | 984 | 686 | -30.3 | 94.4 | 27 |
| Arterra | 300 Berry St | South of Market | 2009 | 17 | 15 | 592 | 803 | 0.801 | 0.982 | 22.6 | 1164 | 1027 | -11.8 | 103.8 | 13 |
| Gramercy Towers | 1177 California St | Nob Hill | 1978 | 17 | 14 | 1139 | 1458.5 | 1.613 | 2.256 | 39.9 | 1087 | 840 | -22.7 | 89.5 | 77 |
| 1000 Third Street | 1000 3rd St | South of Market | 2018 | 17 | 14 | 928 | 1051 | 0.779 | 0.895 | 14.9 | 1265 | 1356 | 7.2 | 99.8 | 11 |
| 2177 Third | 2177 3rd St | Potrero Hill | 2020 | 15 | 15 | 825 | 1290 | 1.147 | 0.945 | -17.6 | 1344 | 1158 | -13.8 | 100.0 | 53 |
| SOMA Grand | 1160 Mission St | South of Market | 2008 | 16 | 13 | 787 | 1158 | 1.041 | 1.174 | 12.8 | 991 | 791 | -20.2 | 100.0 | 35 |
| The Metropolitan | 355 1st St | South of Market | 2004 | 19 | 8 | 840 | 1127 | 1.074 | 1.537 | 43.1 | 1301 | 1176 | -9.6 | 99.2 | 13 |
| Museum Parc | 300 3rd St | South of Market | 1990 | 11 | 15 | 766 | 909 | 0.77 | 1.048 | 36.1 | 888 | 835 | -6.0 | 97.7 | 34 |
| 110 Channel | 110 Channel St | South of Market | 2017 | 13 | 13 | 828 | 906 | 0.984 | 1.088 | 10.6 | 1280 | 1240 | -3.1 | 100.0 | 14 |
| The Hamilton | 631 O'Farrell St | Downtown / Civic Center | 1930 | 14 | 12 | 709 | 850 | 1.363 | 1.635 | 20.0 | 988 | 646 | -34.6 | 95.8 | 81 |
| 950 Tennessee | 950 Tennessee St | Potrero Hill | 2020 | 15 | 11 | 544 | 910 | 0.684 | 0.797 | 16.5 | 1223 | 1104 | -9.7 | 100.0 | 22.5 |
| 101 Lombard | 101 Lombard St | North Beach | 1983 | 10 | 16 | 1248 | 1593 | 0.945 | 1.273 | 34.7 | 931 | 948 | 1.8 | 100.0 | 11 |
| One Hawthorne | 1 Hawthorne St | Financial District | 2010 | 11 | 15 | 1220 | 1448 | 1.019 | 1.257 | 23.4 | 1076 | 933 | -13.3 | 96.2 | 50 |
| Daniel Burnham Court | 1 Daniel Burnham Ct | Western Addition | 1988 | 18 | 8 | 801 | 1306 | 1.043 | 1.741 | 66.9 | 944 | 816 | -13.6 | 98.8 | 32 |
| Brannan | 219 Brannan St | South of Market | 2000 | 15 | 9 | 1204 | 1685 | 1.045 | 1.569 | 50.1 | 1249 | 1210 | -3.1 | 96.7 | 86 |
| The Hayes | 55 Page St | Downtown / Civic Center | 2008 | 12 | 12 | 560 | 686 | 0.753 | 0.859 | 14.1 | 1233 | 1135 | -7.9 | 101.6 | 20 |
| Cathedral Hill Tower | 1200 Gough St | Western Addition | 1966 | 11 | 11 | 831 | 1180 | 0.956 | 1.185 | 24.0 | 944 | 773 | -18.1 | 95.0 | 48 |
| The Austin | 1545 Pine St | Nob Hill | 2017 | 10 | 12 | 929 | 1261.5 | 1.158 | 1.388 | 19.9 | 1313 | 1121 | -14.6 | 96.9 | 47 |
| Watermark | 501 Beale St | South of Market | 2006 | 12 | 10 | 1091 | 1403.5 | 1.071 | 1.341 | 25.2 | 1199 | 1197 | -0.2 | 96.5 | 111 |
| 999 Green | 999 Green St | Russian Hill | 1964 | 9 | 12 | 2245 | 2740 | 1.373 | 1.978 | 44.1 | 1623 | 1785 | 10.0 | 97.7 | 22 |
| 199 New Montgomery | 199 New Montgomery St | Financial District | 2004 | 11 | 9 | 621 | 863 | 0.73 | 0.98 | 34.2 | 1047 | 904 | -13.7 | 97.0 | 63 |
| Fillmore Heritage | 1310 Fillmore St | Western Addition | 2007 | 12 | 8 | 851.5 | 973 | 0.74 | 1.223 | 65.3 | 898 | 987 | 9.9 | 101.3 | 18.5 |
| Sutterfield | 1483 Sutter St | Western Addition | 1993 | 10 | 10 | 756 | 976.5 | 0.957 | 1.085 | 13.4 | 1028 | 890 | -13.4 | 98.6 | 22 |
| Yerba Buena Lofts | 855 Folsom St | South of Market | 2001 | 11 | 8 | 633 | 908.5 | 0.659 | 1.146 | 73.9 | 985 | 905 | -8.1 | 98.6 | 96 |
| Clocktower Lofts | 461 2nd St | South of Market | 1907 | 9 | 9 | 726 | 924 | 0.606 | 1.048 | 72.9 | 901 | 913 | 1.3 | 100.0 | 43 |
| The Lansing | 50 Lansing St | South of Market | 2006 | 10 | 8 | 816 | 1064.5 | 1.005 | 0.977 | -2.8 | 1030 | 1004 | -2.5 | 99.6 | 24 |
The clearest pattern is at the top of the dues range. Eleven of these buildings now charge $1.50 or more per square foot a month, and ten of them saw median sale prices per square foot decline, by a median of about 15%:
- Gramercy Towers (1177 California): dues up 40% per square foot to about $2.26, the highest in the group. Price per square foot fell 23%, and recent sales closed at a median 90% of original list.
- Opera Plaza (601 Van Ness), one of the most-traded buildings in the set: median dues went from $940 to $1,285 a month, and price per square foot fell 18%, from $827 to $674.
- Millennium Tower (301 Mission): median dues went from $1,986 to $2,288; price per square foot fell 18%. This building has its own well-publicized structural history, so dues are only part of its story.
- One Rincon Hill: both towers raised median dues by roughly $430 to $450 a month, and price per square foot fell 13% (425 1st) and 15% (401 Harrison).
- The Hamilton (631 O'Farrell) fell 35% per square foot, the largest drop in the group.
The one high-dues exception is 999 Green on Russian Hill, up about 10% with median dues of $2,740 a month, on a small sample (9 sales in 2020 to 2021, 12 since 2025).
The buildings that held up are mostly newer, with dues closer to $1.00 to $1.35 per square foot. Arden in Mission Bay raised dues per square foot by 35% and still gained about 4% per square foot, with recent sales at 101% of list in a median 12 days. The Avery gained about 6%. The Rockwell barely moved on dues per square foot (about $0.92 to $0.96; the median monthly bill rose more, $712 to $893, which can reflect differences in the sizes and types of units sold) and slipped about 6% on price, while selling at 100% of list in a median 18 days. Lumina raised dues per square foot 19% and gave up about 5%.
One finding I did not expect: across these 44 buildings, how fast dues grew barely predicts the price change (correlation about 0.15). How high dues are now is more closely correlated with it (about -0.35). That pattern is consistent with buyers weighing current carrying costs. It does not isolate buyer motives or the effect of dues from other building differences.
Use the building selector to highlight any of the 44 buildings, or expand the table to compare the underlying figures.
4. Where dues run highest, prices per square foot fell
Where dues run highest, condo prices per sq ft fell
View chart data
Click a column header to sort.
| neighborhood | n_2020_21 | n_2025_26 | median_hoa_2020_21 | median_hoa_2025_26 | hoa_psf_2020_21 | hoa_psf_2025_26 | hoa_psf_change_pct | price_psf_2020_21 | price_psf_2025_26 | price_psf_change_pct |
|---|---|---|---|---|---|---|---|---|---|---|
| Financial District | 144 | 206 | 1239.5 | 2100.0 | 1.012 | 1.476 | 45.8 | 1194 | 1153 | -3.4 |
| Downtown / Civic Center | 207 | 159 | 642.0 | 858.0 | 0.847 | 1.333 | 57.4 | 981 | 786 | -19.9 |
| Diamond Heights | 64 | 48 | 569.0 | 807.5 | 0.802 | 1.15 | 43.4 | 906 | 748 | -17.4 |
| North Beach | 133 | 91 | 894.0 | 1079.0 | 0.879 | 1.104 | 25.6 | 1044 | 987 | -5.5 |
| South of Market | 1075 | 764 | 811.0 | 1050.5 | 0.832 | 1.057 | 27.0 | 1087 | 965 | -11.2 |
| Nob Hill | 197 | 176 | 747.0 | 988.0 | 0.83 | 1.016 | 22.4 | 1127 | 986 | -12.5 |
| Russian Hill | 143 | 129 | 648.0 | 809.0 | 0.517 | 0.857 | 65.8 | 1239 | 1282 | 3.5 |
| Western Addition | 535 | 354 | 521.0 | 734.0 | 0.548 | 0.757 | 38.1 | 1102 | 1053 | -4.4 |
| Potrero Hill | 283 | 189 | 577.0 | 780.0 | 0.543 | 0.736 | 35.5 | 1078 | 1034 | -4.1 |
| Bayview | 76 | 66 | 477.0 | 713.0 | 0.505 | 0.711 | 40.8 | 710 | 626 | -11.8 |
| Pacific Heights | 252 | 192 | 654.5 | 850.0 | 0.53 | 0.68 | 28.3 | 1171 | 1236 | 5.6 |
| The Marina | 179 | 139 | 500.0 | 640.0 | 0.44 | 0.601 | 36.6 | 1216 | 1363 | 12.1 |
| Inner Mission | 424 | 241 | 480.0 | 580.0 | 0.396 | 0.556 | 40.4 | 1060 | 971 | -8.4 |
| Presidio Heights | 60 | 35 | 374.335 | 479.0 | 0.259 | 0.34 | 31.3 | 1138 | 1219 | 7.1 |
| Bernal Heights | 60 | 38 | 325.0 | 420.5 | 0.282 | 0.332 | 17.7 | 1119 | 961 | -14.1 |
| Noe Valley | 97 | 68 | 316.0 | 400.0 | 0.249 | 0.329 | 32.1 | 1132 | 1214 | 7.2 |
| Eureka Valley | 230 | 157 | 350.0 | 408.0 | 0.279 | 0.324 | 16.1 | 1156 | 1207 | 4.4 |
| Sunset District | 77 | 61 | 320.0 | 360.0 | 0.262 | 0.306 | 16.8 | 1054 | 1022 | -3.0 |
| The Richmond District | 188 | 122 | 342.5 | 428.5 | 0.245 | 0.289 | 18.0 | 1025 | 1119 | 9.2 |
| Haight-Ashbury | 213 | 128 | 345.0 | 375.0 | 0.246 | 0.276 | 12.2 | 1118 | 1183 | 5.8 |
I compared the 20 neighborhoods (SFAR districts) with at least 30 condo sales in both periods. The six with 2025 to 2026 median dues above $1.00 per square foot (Financial District, Downtown / Civic Center, Diamond Heights, North Beach, South of Market and Nob Hill) all saw median price per square foot decline, by a median of about 12%. Five of the seven neighborhoods under $0.35 per square foot rose, with a median gain of about 6%. Across all 20, the correlation between dues level and price change is about -0.6.
In dollars, the Financial District stands out: median dues went from $1,240 to $2,100 a month. At 7.18%, that $860 increase is roughly the payment on $127,000 of mortgage.
I would not read this as dues alone pushing prices down. High-dues neighborhoods are also where downtown office vacancy, newer high-rise supply and investor resales concentrate. But dues are the piece of that story an individual buyer can actually underwrite.
5. Within each building era, higher dues were associated with slower sales and smaller overbids
Newer buildings carry higher dues and also tend to sell differently, so I split 2025 to 2026 condo sales into three building eras and then into thirds by dues per square foot within each era.
Within every building era, the highest-dues condos sold for less over asking
View chart data
| era_built | dues_third | n | hoa_psf_min | hoa_psf_max | median_monthly_hoa | median_hoa_psf | median_price_psf | median_sale_to_original_list | median_cumulative_dom | share_over_30_days | relative_price_psf_vs_same_nbhd_size_era |
|---|---|---|---|---|---|---|---|---|---|---|---|
| Pre-1940 | Lowest-dues third | 314 | 0.061 | 0.285 | 315.5 | 0.212 | 1150 | 1.1058 | 13 | 0.239 | 0.994 |
| Pre-1940 | Middle third | 313 | 0.285 | 0.489 | 464.0 | 0.361 | 1169 | 1.0707 | 13 | 0.214 | 1.0105 |
| Pre-1940 | Highest-dues third | 313 | 0.491 | 2.148 | 858.0 | 0.786 | 1051 | 1.0 | 22 | 0.399 | 0.998 |
| 1940-1999 | Lowest-dues third | 319 | 0.061 | 0.667 | 468.0 | 0.396 | 1059 | 1.0578 | 14 | 0.288 | 1.0267 |
| 1940-1999 | Middle third | 319 | 0.675 | 1.121 | 904.0 | 0.908 | 913 | 1.0 | 36 | 0.53 | 1.0044 |
| 1940-1999 | Highest-dues third | 318 | 1.122 | 3.378 | 1279.5 | 1.437 | 866 | 0.9785 | 37 | 0.528 | 0.9724 |
| 2000+ | Lowest-dues third | 484 | 0.033 | 0.827 | 735.0 | 0.603 | 999 | 1.0 | 25 | 0.434 | 0.9636 |
| 2000+ | Middle third | 484 | 0.827 | 1.162 | 976.5 | 1.0 | 1049 | 0.9892 | 28 | 0.461 | 1.0077 |
| 2000+ | Highest-dues third | 484 | 1.163 | 5.514 | 1399.0 | 1.437 | 1098 | 0.9804 | 38 | 0.537 | 1.0266 |
The pattern holds in every era. In pre-1940 buildings, the lowest-dues third sold at a median 111% of original list price and 24% took more than 30 days; the highest-dues third sold at 100% and 40% took more than 30 days. In 1940 to 1999 buildings, the spread was 106% vs 98%. In buildings from 2000 on, it was 100% vs 98%, with 54% of the high-dues third sitting past 30 days.
What surprised me is that price per square foot, measured against similar-size units in the same neighborhood, is roughly flat across the dues thirds (within about 4% either way). Higher-dues buildings usually offer more (elevators, staff, amenities, parking), and the dues appear to offset that premium rather than add to it. These comparisons do not separate the value of amenities from the cost of dues, building condition or other differences.
6. What this means for buyers, sellers and owners
For buyers: compare condos on total monthly cost, not price. Compare any dues difference with its mortgage-debt equivalent at your actual rate (the calculator below illustrates this), then read the HOA budget, the reserve study and the last two years of board minutes before you remove contingencies. A building that has not raised dues in years is not necessarily a bargain; it may be underfunding reserves. My condo vs TIC guide covers what a condo HOA payment includes that a TIC budget often collects separately.
For sellers: price against units with similar dues, not just similar square footage. If your building's dues are above the neighborhood norm, the cohort results suggest allowing for a longer marketing period and a lower sale-to-list ratio, while evaluating your unit and building on their own merits. Disclose the budget, reserves and any planned assessments early; a clear explanation helps buyers evaluate the obligation. My sale price vs list price breakdown shows how condo overbids compare with houses by neighborhood.
For owners and board members: a dues increase changes the cost of ownership and may affect how future buyers compare the property. At the illustrative 7.18% rate, a $150 monthly increase uses the same principal-and-interest budget as roughly $22,000 of mortgage debt. It does not imply a $22,000 loss in market value. That does not mean boards should underfund reserves to keep dues low. It means owners should understand what they are paying for and push for budgets that are clearly explained.
Calculator: compare dues with a mortgage payment
Enter the monthly dues for two units you are comparing. The calculator converts the difference into the mortgage amount the same monthly payment would carry.
A $450 monthly difference is equivalent to about $66,400 of mortgage debt at 7.18% over 30 years.
Illustration only. Assumes a constant dues difference and the same budget for dues plus mortgage principal and interest. Excludes property taxes, insurance, down payment, loan qualification, future dues changes and differences in included services. This is a mortgage-debt equivalent, not a prediction of price or value.
What this data cannot prove
These are closed SFAR condo sales and the HOA figure reported on each listing. Dues cover different things in different buildings (some include heat, water, internet or parking), and special assessments are not captured. The building match uses map coordinates, so a few sites with multiple buildings may be grouped together. None of these comparisons isolate dues as the cause of a price change. They show that dues rose much faster than prices, in the same buildings and across the city, and that high-dues units have sold on weaker terms.
Methodology and sources
Data: User-supplied summaries of SFAR MLS closed sales, extracted via the TurboHome data warehouse. Individual transaction records were not provided for this publication. Analysis and charts: Caley Zheng.
- Scope: San Francisco County, property type Condominium only. TICs (whose dues usually exclude the shared mortgage and taxes) and stock cooperatives (whose dues usually include them) are excluded so the dues figures are comparable.
- Filters: closing date on or before November 5, 2026; close price above zero; monthly HOA between $100 and $6,000; living area 300 to 5,000 square feet. Medians throughout.
- Periods: Chart 1 compares January to October closings each year 2020 to 2026 (n = 1,243 to 2,504 per year; 1,703 in 2026). Charts 2 and 5 compare full-year 2020 to 2021 closings (n = 4,830) with 2025 to November 5, 2026 closings (n = 3,497); charts 3 and 4 use the building subset described below. Chart 6 uses 2025 to November 5, 2026 closings with a known year built (n = 3,348).
- Same-building match: listings grouped by latitude and longitude rounded to four decimals; 653 locations with sales in both periods.
- Buildings: identified by street address with the unit removed; multi-address complexes combined (Lumina: 201 Folsom, 318 and 338 Main, 333 Beale; The Infinity: 301 Main and 338 Spear; The Beacon: 250 and 260 King; Arden: 708 and 718 Long Bridge). Only buildings with 8+ sales in each period are shown (44 buildings, 1,657 sales); building medians rest on 8 to 71 sales per period, so treat single-building figures as indicative. Names come from the HOA name in MLS records; where that field held a management company, the street address is used.
- Neighborhoods: SFAR district names; only districts with 30+ sales in each period are shown.
- Sale outcomes: sale-to-original-list = close price divided by original list price (ratios outside 50% to 250% dropped). Over 30 days = more than 30 cumulative days on market. Relative price per square foot compares each sale with the median of sales in the same era, neighborhood and size band (cells with 5+ sales).
- Loan equivalent: present value of the monthly dues over 30 years at 7.18%.
- Mortgage-rate benchmark: Freddie Mac PMMS release, November 5, 2026. The 7.18% national average is a benchmark, not a loan quote.
Related reading: How to Buy a Home in San Francisco: Offer Strategy, Inspections, and Pricing.
Looking at a condo and want to know what the dues are really costing you? Let's work through the numbers together. Talk to Caley
Working through a TIC decision? The TIC learning center connects the ownership, financing, costs, and buyer-diligence guides.