A TIC can cost less than a condo without being the cheaper choice in every comparison.
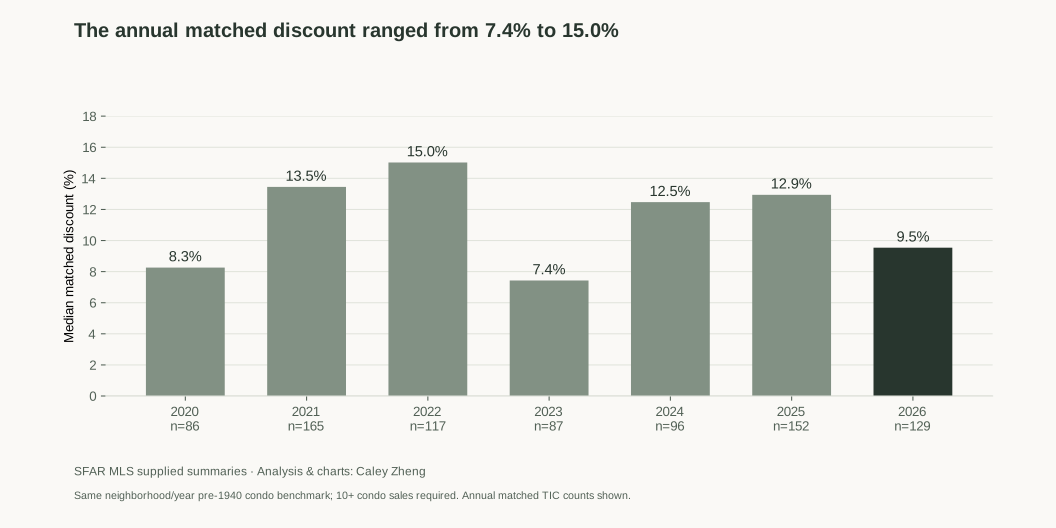
In the supplied SFAR data, the 2026 matched TIC discount is 9.5% per square foot against an older-condo benchmark in the same neighborhood and year. Across 2020 through 2026, the annual matched discounts range from 7.4% to 15.0%. The middle of those seven annual figures is 12.5%.
That is a useful starting point for a buyer comparing ownership options, provided we keep the comparison straight. It is not a universal percentage to subtract from a condo listing, and it is not a measured adjustment for every difference between two homes.
I analyzed three supplied SFAR summaries covering prices, market pace, and neighborhood-and-year benchmarks. They contain 832 matched TIC sales. The annual charts compare January through October of each year so that the calendar windows line up. The neighborhood chart uses a separate pooled period from January 2024 through November 5, 2026.
1. The size of the gap depends on the condo benchmark.
A flat in an older building and a newer high-rise condo can offer different layouts, amenities, locations, and carrying costs. Comparing ownership categories without considering those differences can hide as much as it reveals.
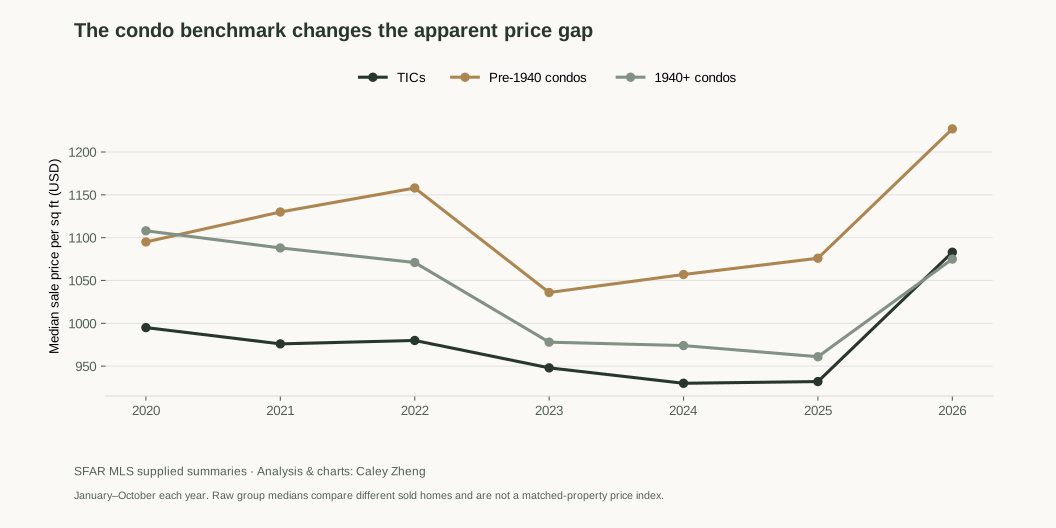
The condo benchmark changes the apparent price gap
View chart data and downloads
| Year | Group | Sales | Median price per sq ft | Median close / original list | Median cumulative days on market | Share over original list |
|---|---|---|---|---|---|---|
| 2020 | Condo, 1940+ building | 992 | $1,108 | 100.0% | 29 | 35.7% |
| 2020 | Condo, pre-1940 building | 448 | $1,095 | 100.1% | 20 | 50.2% |
| 2020 | TIC | 120 | $995 | 100.0% | 35 | 45.8% |
| 2021 | Condo, 1940+ building | 1917 | $1,088 | 100.0% | 28 | 41.5% |
| 2021 | Condo, pre-1940 building | 723 | $1,130 | 106.7% | 13.5 | 67.6% |
| 2021 | TIC | 214 | $976 | 100.0% | 44.5 | 43.5% |
| 2022 | Condo, 1940+ building | 1444 | $1,071 | 100.0% | 27 | 41.7% |
| 2022 | Condo, pre-1940 building | 548 | $1,158 | 105.8% | 14 | 69.7% |
| 2022 | TIC | 166 | $980 | 100.0% | 35 | 50.0% |
| 2023 | Condo, 1940+ building | 903 | $978 | 97.7% | 39 | 25.7% |
| 2023 | Condo, pre-1940 building | 396 | $1,036 | 100.0% | 22.5 | 45.5% |
| 2023 | TIC | 149 | $948 | 97.9% | 36 | 30.2% |
| 2024 | Condo, 1940+ building | 1064 | $974 | 98.2% | 36 | 27.6% |
| 2024 | Condo, pre-1940 building | 387 | $1,057 | 100.3% | 20 | 52.2% |
| 2024 | TIC | 140 | $930 | 100.0% | 31 | 40.0% |
| 2025 | Condo, 1940+ building | 1131 | $961 | 97.9% | 37 | 28.0% |
| 2025 | Condo, pre-1940 building | 456 | $1,076 | 101.1% | 18 | 53.5% |
| 2025 | TIC | 181 | $932 | 98.5% | 38 | 38.7% |
| 2026 | Condo, 1940+ building | 1279 | $1,075 | 100.0% | 20 | 48.8% |
| 2026 | Condo, pre-1940 building | 492 | $1,227 | 112.7% | 13 | 79.3% |
| 2026 | TIC | 177 | $1,083 | 106.9% | 15 | 66.7% |
Download readable CSV · Download chart PNG · Download chart SVG
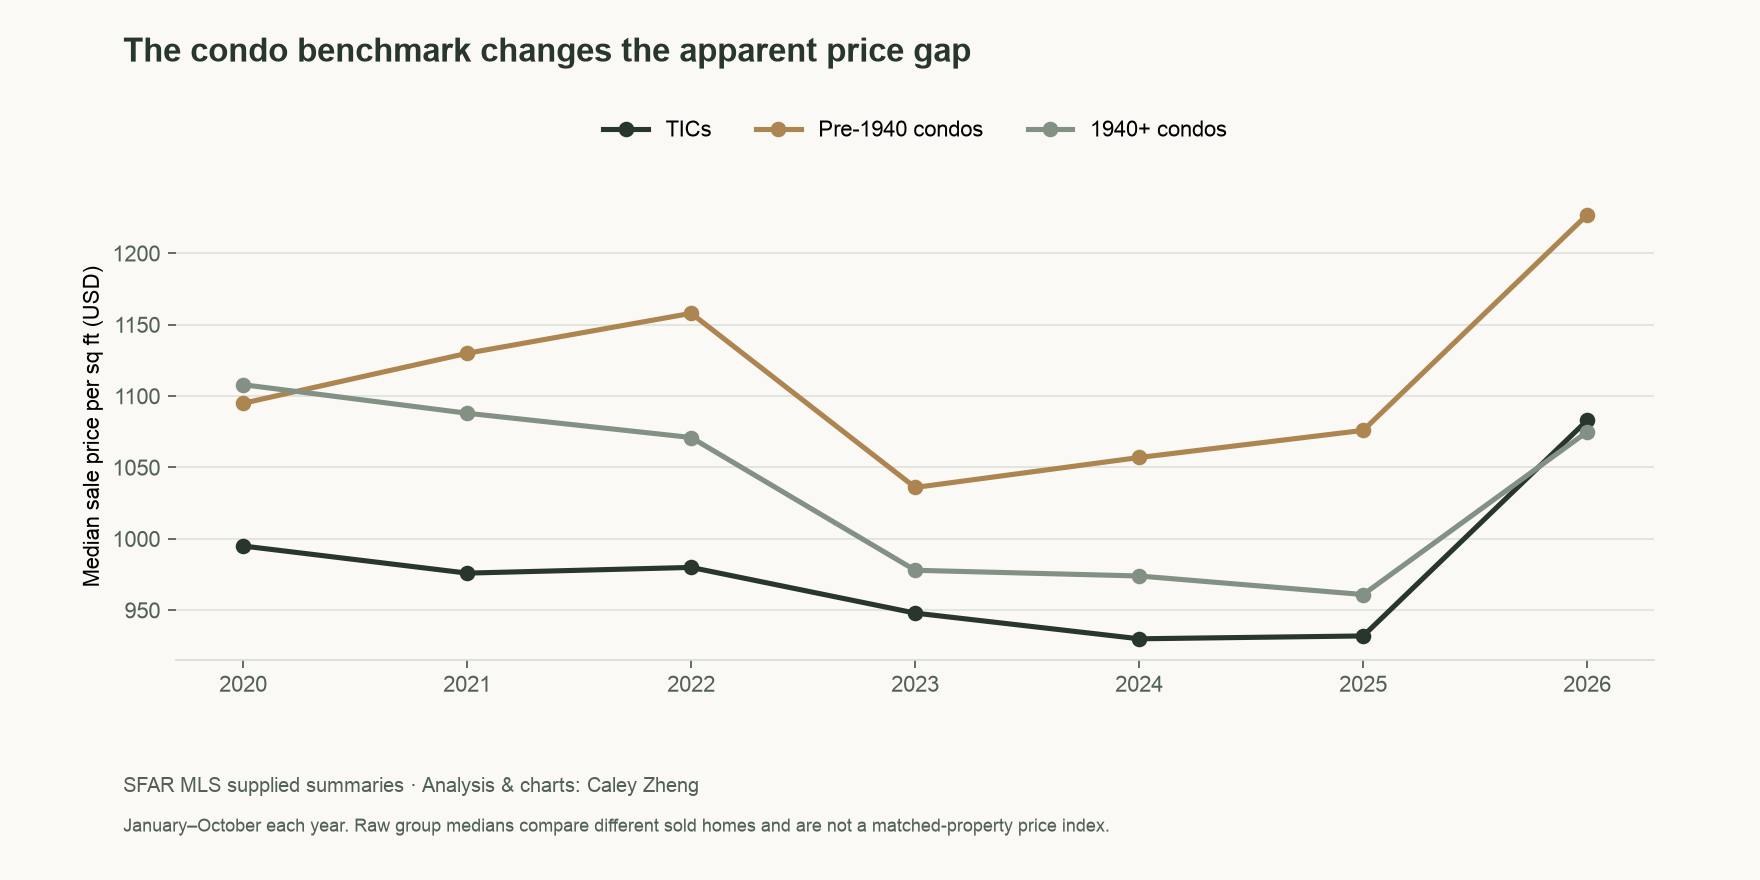
For January through October 2026, the median TIC sold at $1,083 per square foot. Condos in buildings dated 1940 or later sold at $1,075, while condos in pre-1940 buildings sold at $1,227. In that raw comparison, TICs were slightly above the newer-building group and about 11.7% below the older-building group.
Those figures do not establish that ownership structure explains the difference. The properties sold in different neighborhoods, and the homes themselves can differ substantially. The supplied data also does not provide a single combined median for every condo in the city, so I would not describe either building-era group as “all condos.”
The practical question is which condo a buyer would reasonably consider alongside the TIC. My complete TIC buyer’s guide explains the ownership structure, while my TIC buying overview covers questions to investigate before an offer. For valuation, San Francisco Real Estate Company’s comparable-sales guide is useful for thinking through location, condition, lawful space, and timing.
2. Matching by neighborhood and year produces a clearer reference.
For each TIC sale, the report divides its price per square foot by the median for pre-1940 condos sold in the same SFAR neighborhood and calendar year. A neighborhood-year benchmark needs at least ten condo sales. The annual result is the median of those individual TIC-to-benchmark ratios.
A median ratio of 0.9046 means the matched TIC group sold at about 90.5% of its condo benchmark, giving the 9.54% discount reported for 2026. This is different from dividing the citywide TIC median of $1,083 by the older-condo median of $1,227, which produces the raw 11.7% gap above.
The annual matched discount ranged from 7.4% to 15.0%
View chart data and downloads
| Year | Matched TIC sales | Neighborhoods | Median TIC / condo benchmark ratio | Matched discount | Matched TIC cumulative DOM | Condo benchmark cumulative DOM |
|---|---|---|---|---|---|---|
| 2020 | 86 | 14 | 0.9174 | 8.3% | 37.5 | 21 |
| 2021 | 165 | 16 | 0.8655 | 13.5% | 45 | 13 |
| 2022 | 117 | 11 | 0.8498 | 15.0% | 36 | 15 |
| 2023 | 87 | 11 | 0.9257 | 7.4% | 43 | 20 |
| 2024 | 96 | 12 | 0.8753 | 12.5% | 34 | 18 |
| 2025 | 152 | 13 | 0.8706 | 12.9% | 37 | 19 |
| 2026 | 129 | 13 | 0.9046 | 9.5% | 14 | 13 |
Download readable CSV · Download chart PNG · Download chart SVG
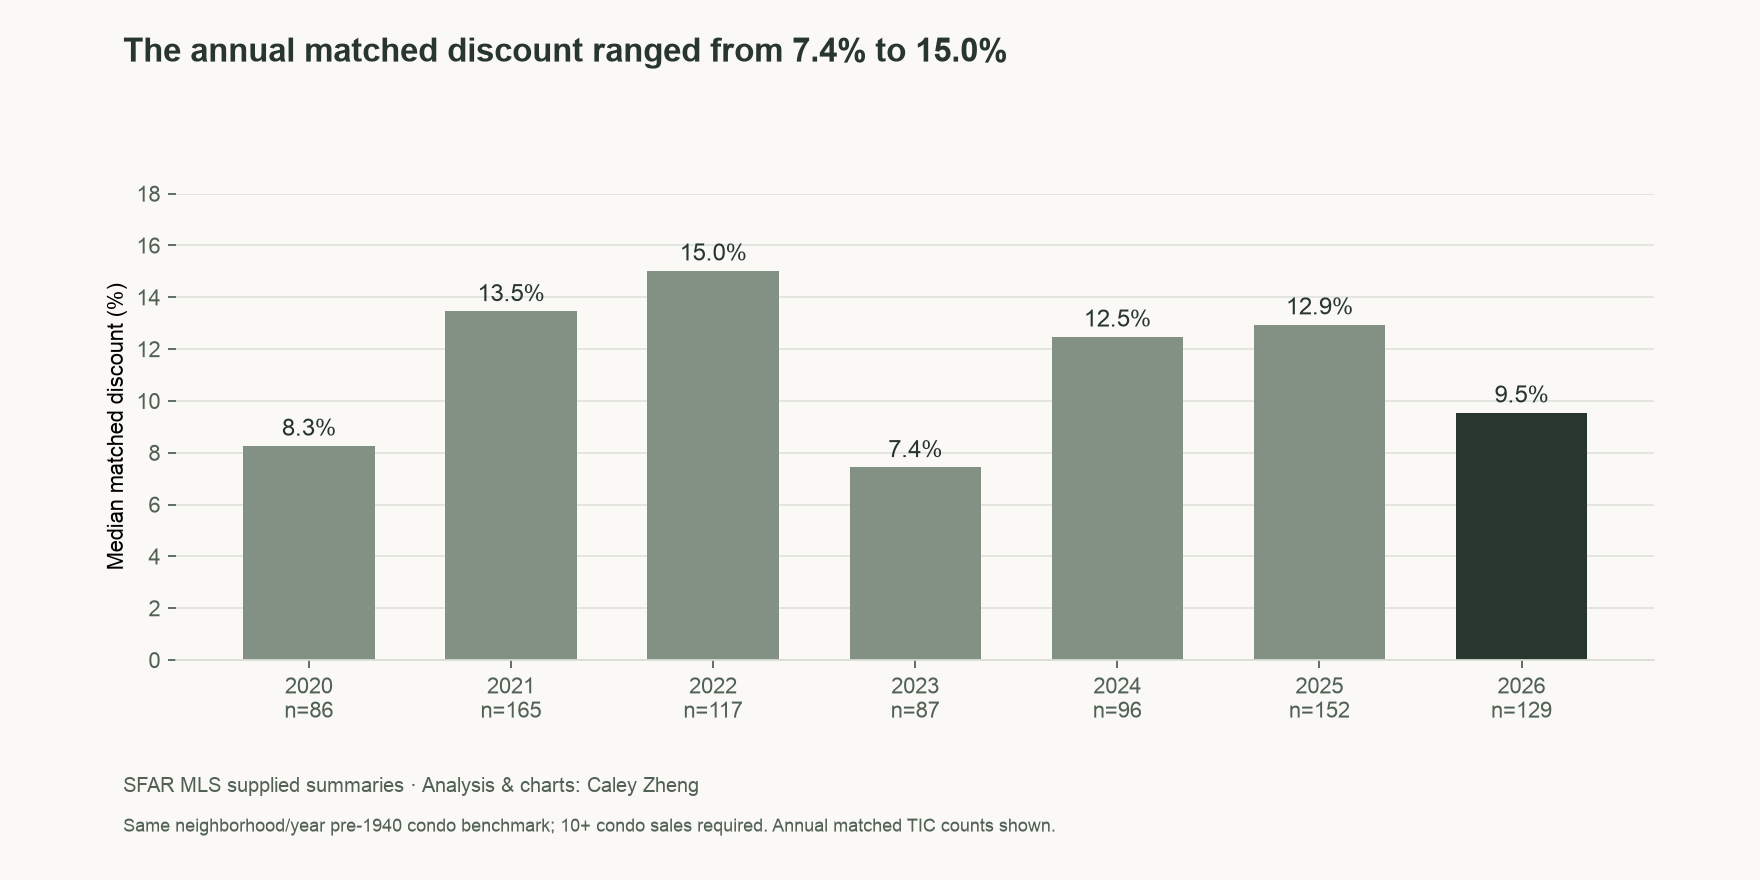
The widest annual matched discount was 15.02% in 2022; the narrowest was 7.43% in 2023. The median of the seven annual discounts is 12.47%, or about 12.5%. That gives each year equal weight. It is not a pooled median discount across all 832 sales, which cannot be recovered from these annual summaries alone.
The 2026 matched group contains 129 TIC sales in 13 neighborhoods. The broader annual TIC group contains 177 sales. I keep those groups separate: the matched discount uses the 129 eligible observations, while the raw price and market-pace charts use all 177.
One possible explanation for the changing gap is that financing and buyer preferences affect TICs and condos differently. The data here cannot isolate that mechanism. The pattern is worth investigating, but it does not prove that lending conditions caused the discount to widen or narrow.
3. The marketing-time gap narrowed sharply in 2026.
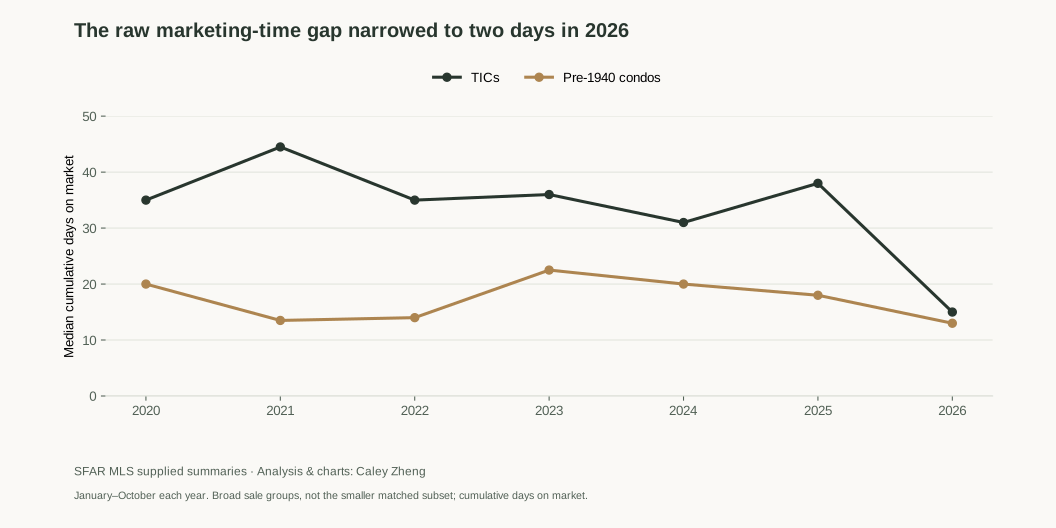
In the broader January-to-October series, TICs took a median of 31 to 44.5 cumulative days on market during 2020 through 2025. The pre-1940 condo group ranged from 13.5 to 22.5 days. In 2026, the figures were 15 days for TICs and 13 for older condos.
The raw marketing-time gap narrowed to two days in 2026
View chart data and downloads
| Year | TIC cumulative DOM | Pre-1940 condo cumulative DOM | TIC share over original ask | Pre-1940 condo share over ask |
|---|---|---|---|---|
| 2020 | 35 | 20 | 45.8% | 50.2% |
| 2021 | 44.5 | 13.5 | 43.5% | 67.6% |
| 2022 | 35 | 14 | 50.0% | 69.7% |
| 2023 | 36 | 22.5 | 30.2% | 45.5% |
| 2024 | 31 | 20 | 40.0% | 52.2% |
| 2025 | 38 | 18 | 38.7% | 53.5% |
| 2026 | 15 | 13 | 66.7% | 79.3% |
Download readable CSV · Download chart PNG · Download chart SVG
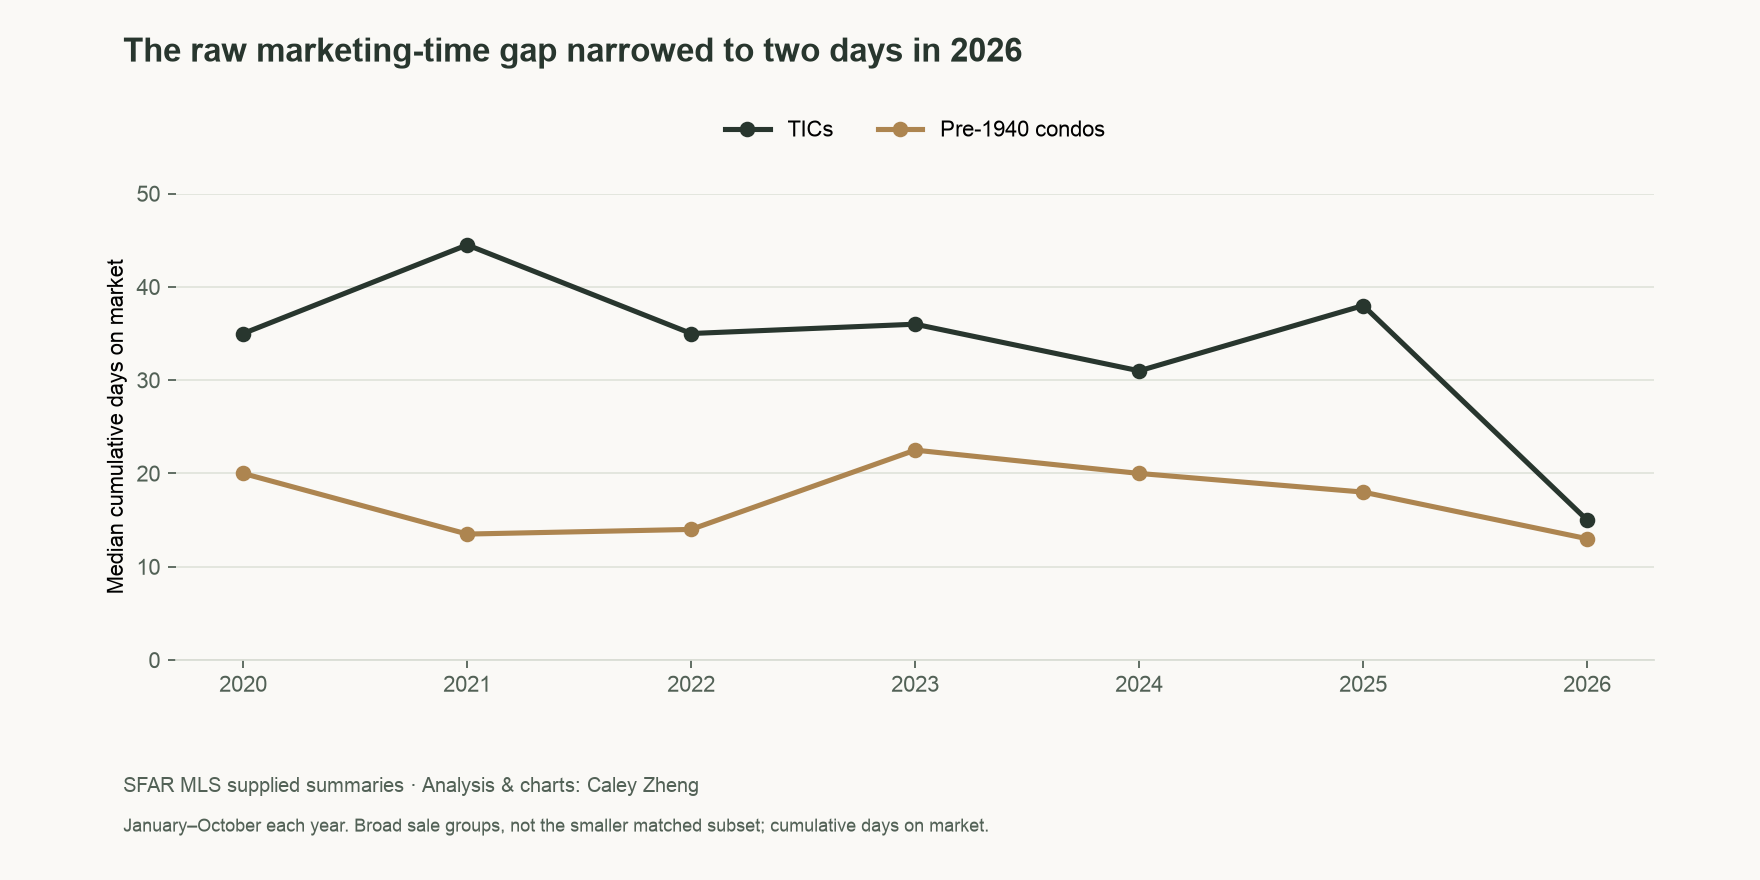
That is a two-day gap, rather than identical selling times. TICs also became more competitive relative to original asking prices: 66.7% sold above original ask in 2026, compared with 38.7% in 2025. The median TIC closing ratio rose from 98.54% to 106.92%. These are closed-sale observations, not the probability that any active listing will sell on the same timetable.
The raw TIC median price per square foot rose from $932 to $1,083, about 16.2%, while the older-condo median rose from $1,076 to $1,227, about 14.0%. Different homes sold in each period, so I would not treat those changes as appreciation of the same properties.
For context, Redwood Credit Union’s October 22 release reported that its San Francisco TIC lending increased from $48.8 million in the second half of 2024 to $99.3 million in the first half of 2026. That is the lender’s own activity, not a citywide mortgage total. It supports taking financing access seriously, but it does not prove why the SFAR marketing-time gap narrowed.
Redwood’s TIC loan page describes its specialized program and a 20% down-payment requirement as reviewed for this article. Confirm the current terms and property eligibility with the lender. San Francisco Real Estate Company’s TIC financing guide provides additional context on fractional loans, ownership agreements, and the shared building budget.
4. The neighborhood results deserve their own comparison.
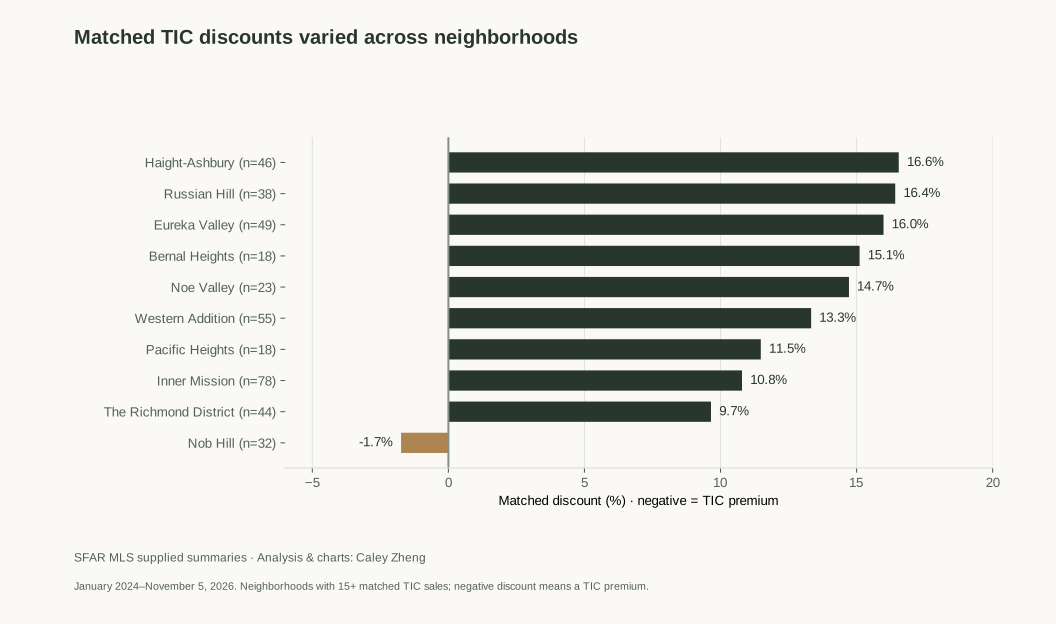
The pooled neighborhood table covers January 2024 through November 5, 2026 and includes groups with at least 15 matched TIC sales. It is a different window from the annual January-to-October charts.
Matched TIC discounts varied across neighborhoods
View chart data and downloads
| Neighborhood | Matched TIC sales | Pre-1940 condo count | Matched discount (negative = premium) | TIC median price per sq ft | Condo median price per sq ft |
|---|---|---|---|---|---|
| Haight-Ashbury | 46 | 146 | 16.6% | $939 | $1,168 |
| Russian Hill | 38 | 93 | 16.4% | $1,008 | $1,170 |
| Eureka Valley | 49 | 133 | 16.0% | $1,017 | $1,203 |
| Bernal Heights | 18 | 34 | 15.1% | $839 | $1,001 |
| Noe Valley | 23 | 52 | 14.7% | $1,043 | $1,214 |
| Western Addition | 55 | 173 | 13.3% | $937 | $1,063 |
| Pacific Heights | 18 | 188 | 11.5% | $1,059 | $1,172 |
| Inner Mission | 78 | 139 | 10.8% | $880 | $1,003 |
| The Richmond District | 44 | 95 | 9.7% | $925 | $1,052 |
| Nob Hill | 32 | 50 | -1.7% | $970 | $947 |
Download readable CSV · Download chart PNG · Download chart SVG
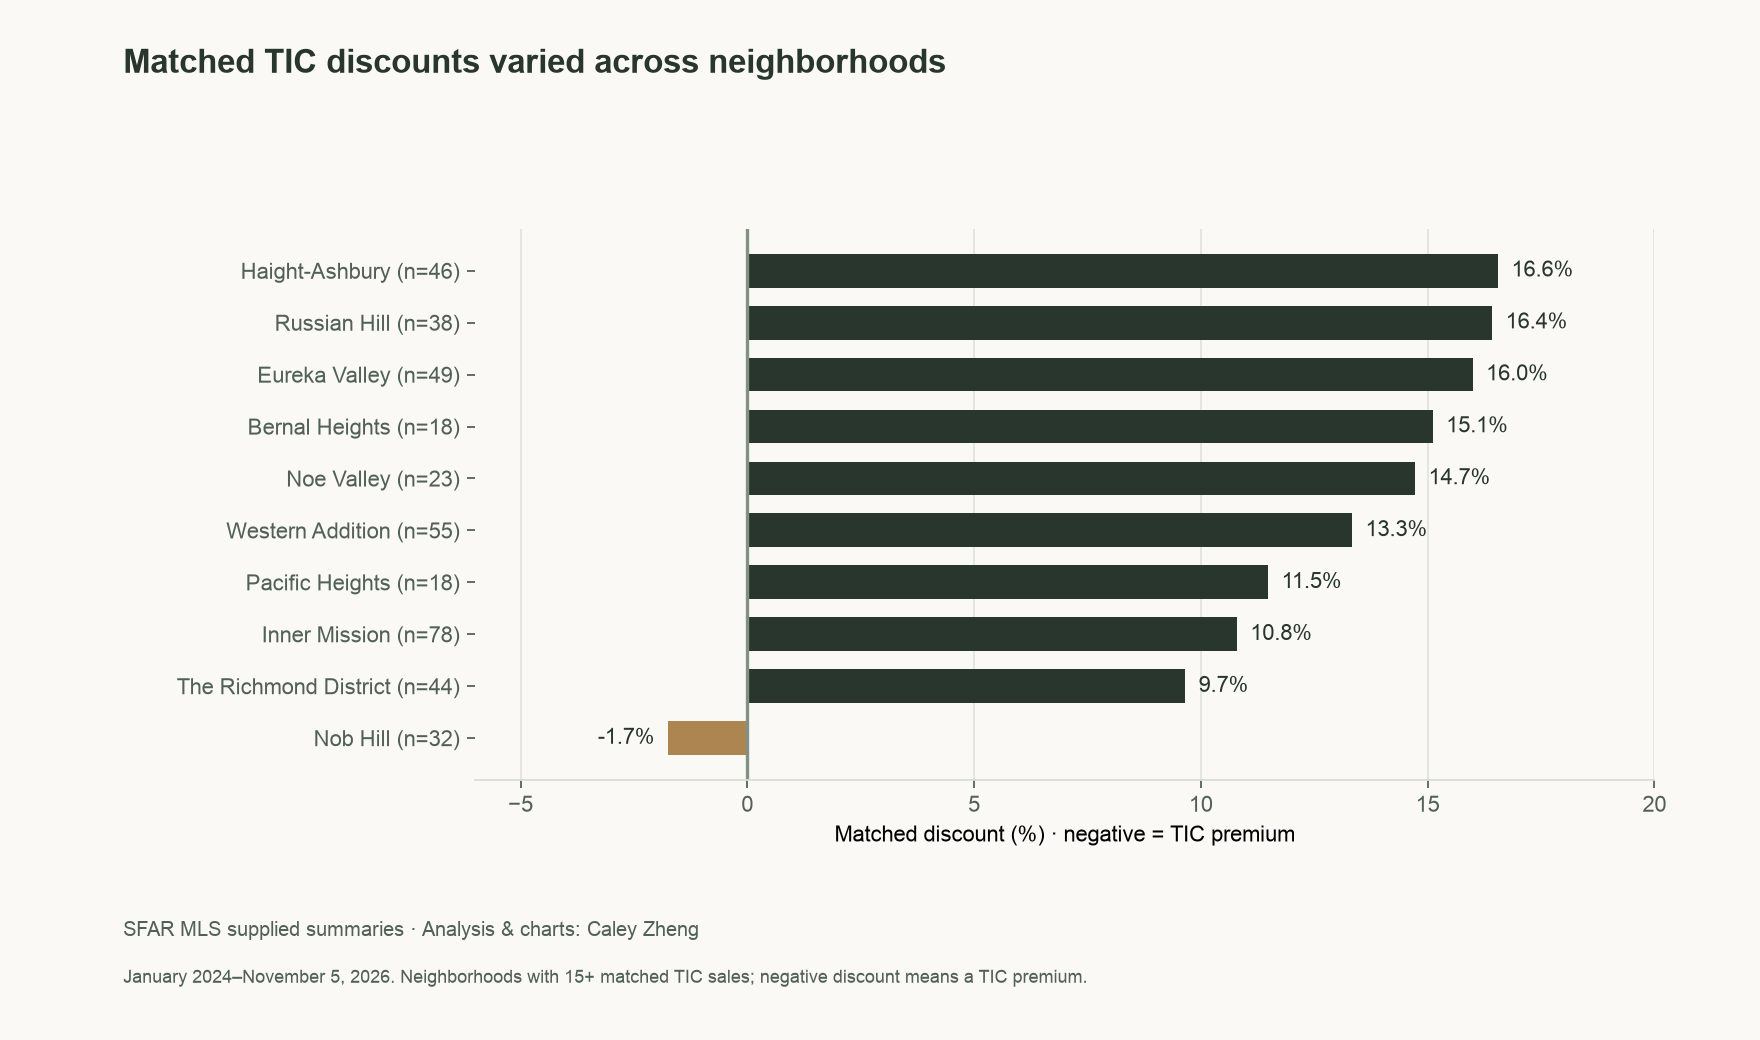
The matched discounts were approximately 16% to 17% in Haight-Ashbury, Russian Hill, and Eureka Valley; about 15% in Bernal Heights and Noe Valley; and roughly 10% to 13% in Western Addition, Pacific Heights, Inner Mission, and the Richmond group.
Nob Hill is the exception in this table. Its median ratio of 1.0174 indicates a 1.74% TIC premium against the older-condo benchmark, based on 32 matched TIC sales. I would not force that result into a citywide discount rule.
Sample sizes vary. Bernal Heights and Pacific Heights each have 18 matched TIC sales; Noe Valley has 23. The summaries do not provide confidence intervals, so I cannot establish that a small difference between two neighborhoods is statistically meaningful. A rounded ranking is a starting point for further comparison, not a precise pricing ladder.
If you are weighing nearby neighborhoods, my Hayes Valley buyer’s guide, NoPa guide, and Mission Dolores guide add block-level context. San Francisco Real Estate Company’s neighborhood market reports offer another lens, with their own property types, boundaries, and periods.
5. Use the discount as a comparison worksheet.
The worksheet below applies one of the reported cohort discounts to a condo price-per-square-foot assumption and a home size. It shows the arithmetic behind the comparison. It does not estimate the value of a specific TIC, recommend an offer, or include loan costs, shared expenses, repairs, or conversion costs.
Illustrate a neighborhood comparison
This applies a historical cohort ratio to your assumptions. It is not an appraisal or an offer recommendation.
Western Addition: 13.33% matched discount, 55 matched TIC sales. Pooled January 2024–November 5, 2026. Values rounded to the nearest $1,000.
The comparison holds area and the condo benchmark fixed. It excludes financing, shared expenses, taxes, repairs, and transaction or conversion costs. Your inputs remain in this page and are not submitted.
For example, a hypothetical 1,000-square-foot home and a $1,200-per-square-foot condo benchmark produce a $1.2 million starting comparison. Applying Western Addition’s 13.33% pooled adjustment gives about $1.040 million, rounded to the nearest $1,000. That is a numerical scenario, not an observed sale or a valuation.
I would choose the condo comparison carefully before touching the discount. Parking, renovation quality, outlook, floor level, outdoor space, and the accuracy of the reported living area can each change whether the reference is useful. San Francisco’s Property Information Map is one starting point for property records, alongside the disclosures and the building’s documents.
6. What I would check before buying or selling.
For a buyer, the price gap needs to be weighed against the full ownership arrangement. I want the TIC agreement, the proposed loan, shared reserves, insurance, maintenance obligations, and the rights attached to the interest being purchased. A lower price does not automatically mean a lower total cost or a simpler ownership experience.
A TIC interest and a condominium unit are different forms of ownership. Redwood’s program describes an agreement that assigns exclusive use within a shared title. I would have the proposed agreement and financing reviewed for that particular building instead of assuming every TIC works the same way. The California Department of Real Estate’s buyer guidance also emphasizes reviewing disclosures and understanding purchase terms.
For a seller, I would build a value range from actual comparable sales. The matched neighborhood result is a useful check, but I would not subtract a fixed percentage from a condo asking price and call the job done. My sale-price versus list-price analysis explains why asking prices and market value need separate treatment.
For a whole-building owner, the discount is one input in a much larger decision. Selling interests separately brings legal, financing, transaction, occupancy, and timing questions that a per-square-foot chart cannot settle. My guide to splitting a multifamily property into TICs introduces that process, and my Hayes Valley multifamily study adds context for evaluating a whole-building sale.
I would also keep condominium conversion out of the base case unless the actual property has a verified pathway. TIC ownership does not automatically create conversion eligibility. San Francisco Public Works maintains the subdivision and conversion resources, including its Expedited Conversion Program update.
The comparison I find most useful is a specific one: does the TIC offer enough value for its particular home, loan, and shared responsibilities? The matched data helps frame that conversation. The agreement and the actual property help answer it.
Weighing a TIC against a condo? Let’s work through the numbers together. You can also explore my featured transactions and read more buying and ownership guides.
Methodology, sources, and limits
Data: SFAR MLS, supplied aggregate CSVs dated November 5, 2026. Analysis and charts: Caley Zheng. The scope is San Francisco County condominium and tenancy-in-common closings. Townhouses, co-ops, and income properties are excluded. The source describes excluding future-dated closes, null or zero prices, living area outside 300 to 5,000 square feet, and sale-to-list ratios outside 50% to 250%. Raw transaction rows were not available to independently rerun those filters or audit living area.
Annual price and pace charts: January 1 through October 31 in each year, 2020 through 2026. The price series has separate TIC, pre-1940 condo, and 1940-or-later condo groups. It does not contain a combined all-condo median. Cumulative days on market is the source field, not a promise about the timing of a future sale.
Annual matched comparison: each TIC’s price per square foot divided by the median for pre-1940 condos, defined in the report as MLS year built 1850 through 1939, in the same SFAR neighborhood and calendar year. A benchmark needs at least ten condo sales. The seven annual matched counts sum to 832, ranging from 86 to 165. A positive discount is 1 minus the median ratio. The summaries do not establish a causal ownership penalty or equalize condition, size, views, parking, floor, and outdoor space.
Neighborhood comparison: pooled closings from January 1, 2024 through November 5, 2026; ten shown neighborhoods have at least 15 matched TIC sales. Their TIC counts total 401. These are the supplied qualifying neighborhood groups, not a claim that all matched sales or every neighborhood appear. A median of individual benchmark ratios is different from a ratio of the neighborhood’s two raw price medians.
Lender context: Redwood Credit Union’s October 22 release reports its own lending and separately cites a 19% price-per-square-foot comparison in higher-priced neighborhoods. Its $1,163 TIC and $1,434 condo figures use a different sample and method from this analysis. They do not contradict the 9.5% matched 2026 result, and I do not combine the two datasets or infer causality from the lender’s growth.
View reconciliation notes and source downloads
The 12.5% figure is the unweighted median of seven annual discounts, not a pooled 832-sale median. The 2026 broad group has 177 TIC sales, while the matched group has 129; its cumulative marketing time is 14 days versus 13 for its benchmark, compared with 15 versus 13 in the broader raw groups. The pace narrative uses the broader groups consistently. Nob Hill’s negative discount is a premium. No fixed statistical error band or individual offer recommendation is established.
The original supplied CSVs are available here: annual price and pace data, annual matched data, and pooled neighborhood data. Each chart also has a readable table and PNG/SVG downloads.