Before I tell a buyer how far over asking a home might sell, I want to know what kind of home we are talking about.
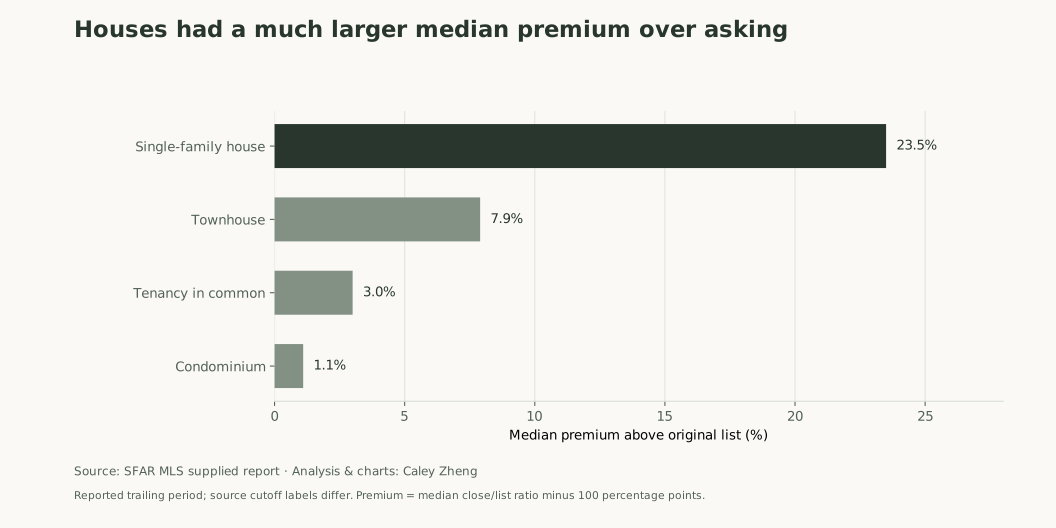
In the supplied SFAR sales summary, the median single-family house closed at 123.5% of its original list price, while the median condo closed at 101.1%. Both numbers describe San Francisco during the report’s trailing period. They suggest very different offer conversations.
I worked through the report’s annual, quarterly, neighborhood, price-band, and property-type tables to understand where those differences come from. The annual summary contains about 31,000 closings from 2020 through 2026 year to date. My goal is to make the asking-price statistics useful without turning them into a rule that tells someone to bid 23.5% more on every house.
1. An overbid measures the relationship to an asking price.
Throughout this article, close versus list means the closing price divided by the original asking price. A 110% ratio means a sale closed 10% above its first list price. It does not mean the property appreciated 10%, sold 10% above appraised value, or beat the seller’s private expectations by 10%.
“Share over ask” answers a separate question: what percentage of the recorded sales closed above their original list price at all? A market can have many small overbids and a fairly modest median ratio. Neither measure tells us what happened to listings that never sold.
Here is a simple illustration. A house listed at $1.5 million and sold for $1.8 million closes at 120% of ask. If recent comparable sales already supported $1.8 million, that result could be consistent with market value. The 20% describes the gap to the chosen asking price. For a practical valuation framework, I like San Francisco Real Estate Company’s guide to estimating value from comparable sales.
2. Houses and condos need different starting points.
The property-type split is the most useful first filter in this report. Of 1,956 house sales, 86% closed above original ask, and the median dollar premium was $401,500. Of 2,199 condo sales, 55% closed above ask, with a median dollar premium of $10,000. The median ratio differs by 22.4 percentage points.
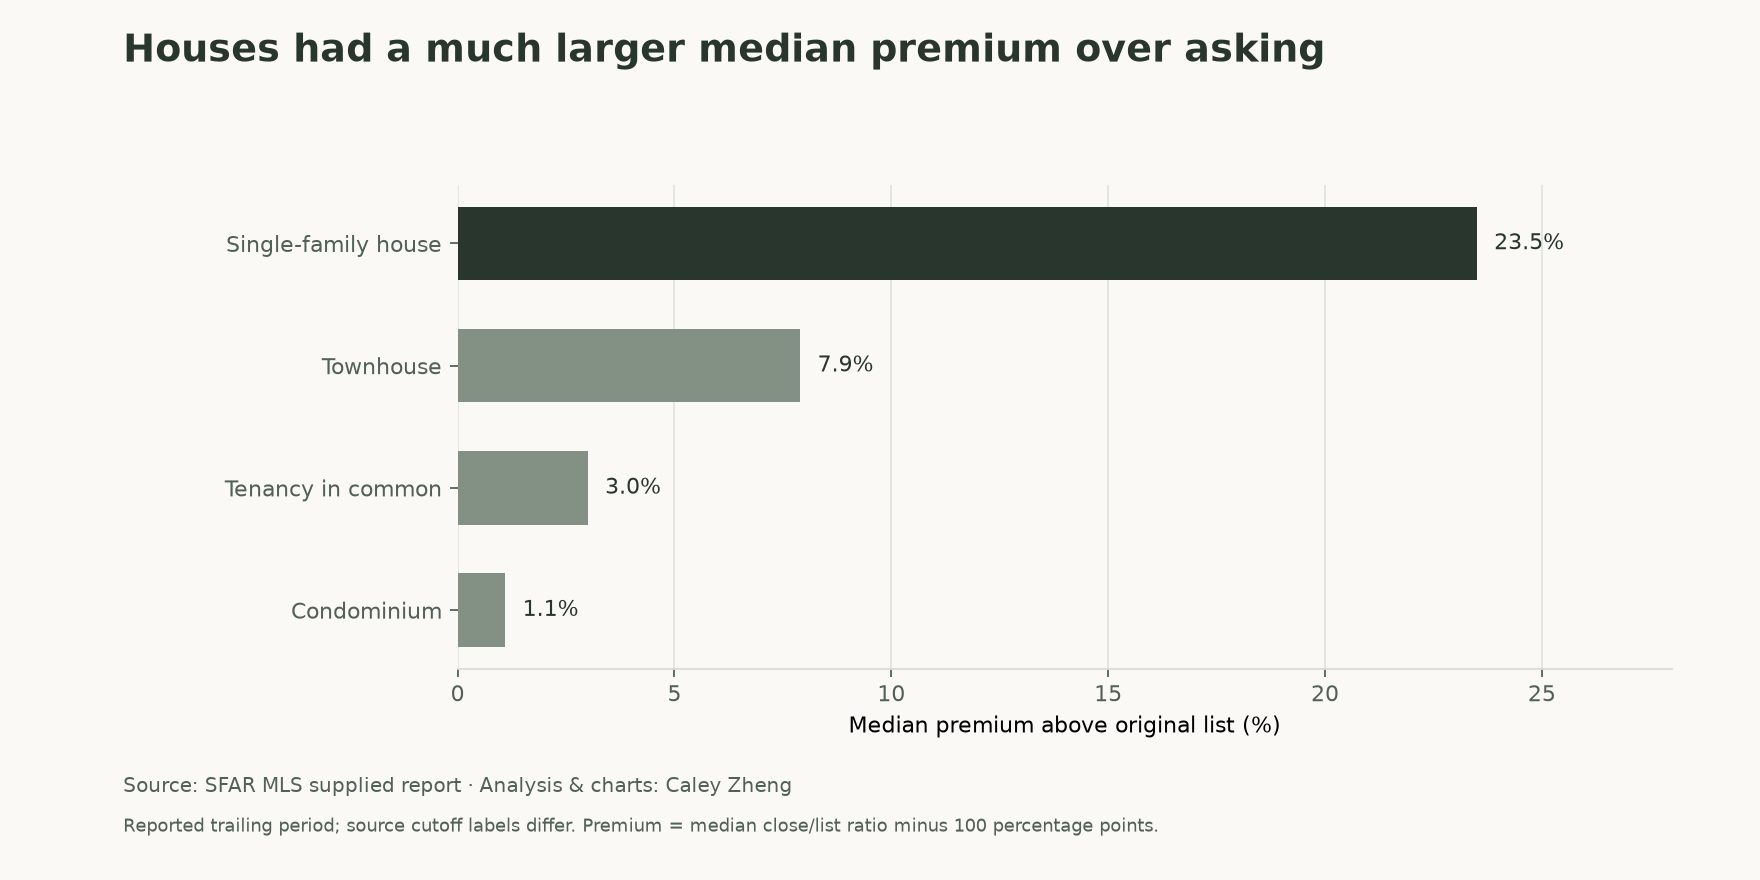
Houses had a much larger median premium over asking
View chart data and downloads
| Property type | Sales | Median close / original list | Share over ask | 90th percentile close / list | Median days on market | Median dollars over ask |
|---|---|---|---|---|---|---|
| Single-family house | 1,956 | 123.5% | 86% | 155% | 12 | $401,500 |
| Townhouse | 34 | 107.9% | 68% | 135% | 20 | $87,000 |
| Tenancy in common | 298 | 103.0% | 59% | 126% | 22 | $31,000 |
| Condominium | 2,199 | 101.1% | 55% | 126% | 17 | $10,000 |
A condo buyer should not automatically import the house numbers into an offer. A house buyer should not assume that a condo-heavy citywide average describes the competition. I still want the relevant block, size, condition, parking, outdoor space, and ownership details before estimating a price.
The smaller ownership categories deserve the same discipline. The report lists a 103.0% median ratio for 298 TIC sales and 107.9% for 34 townhouse sales. The townhouse group is much smaller, and ownership structure can change financing and shared expenses. My complete TIC buyer’s guide and TIC purchase overview explain the questions I would investigate before comparing those homes with condos.
For a downtown condo, I also want the full monthly ownership cost and the building’s documents. San Francisco Real Estate Company’s Rincon Hill, South Beach, and Financial District condo guide adds useful context on HOA dues and carrying costs. Its data has a different geography and reporting window, so I use it as related reading rather than combine its figures with this sample.
3. The neighborhood spread is too large to ignore.
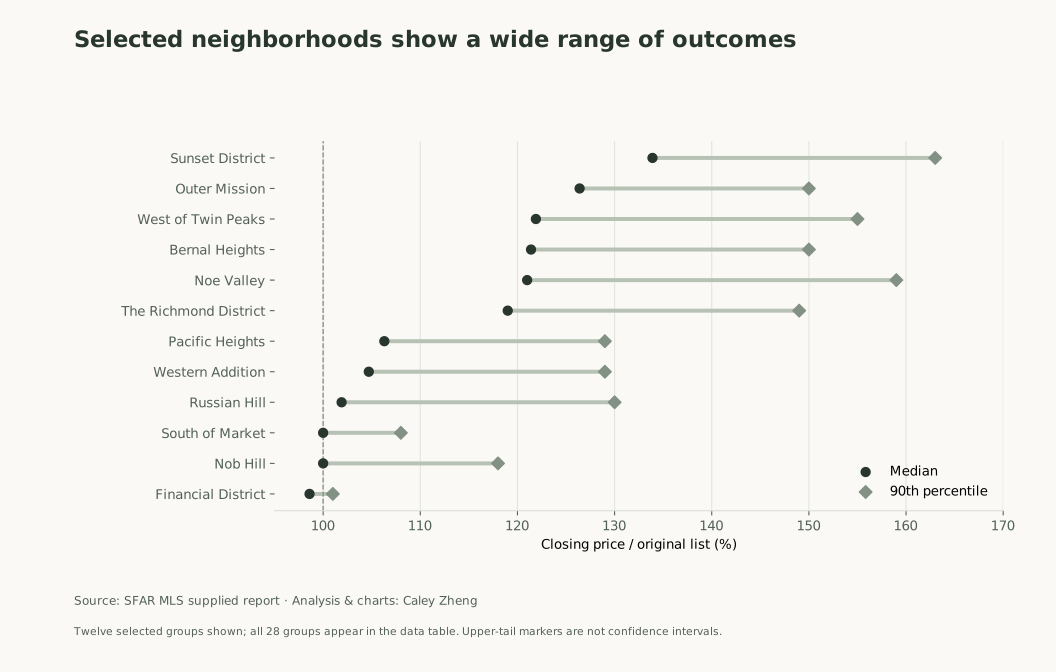
The Sunset group’s median closing was 133.9% of original list, compared with 98.6% in the Financial District. That is a 35.3-percentage-point spread. The Sunset also had 89% of recorded sales above ask and a 12-day median marketing period. The Financial District had 15% above ask and 44 median days.
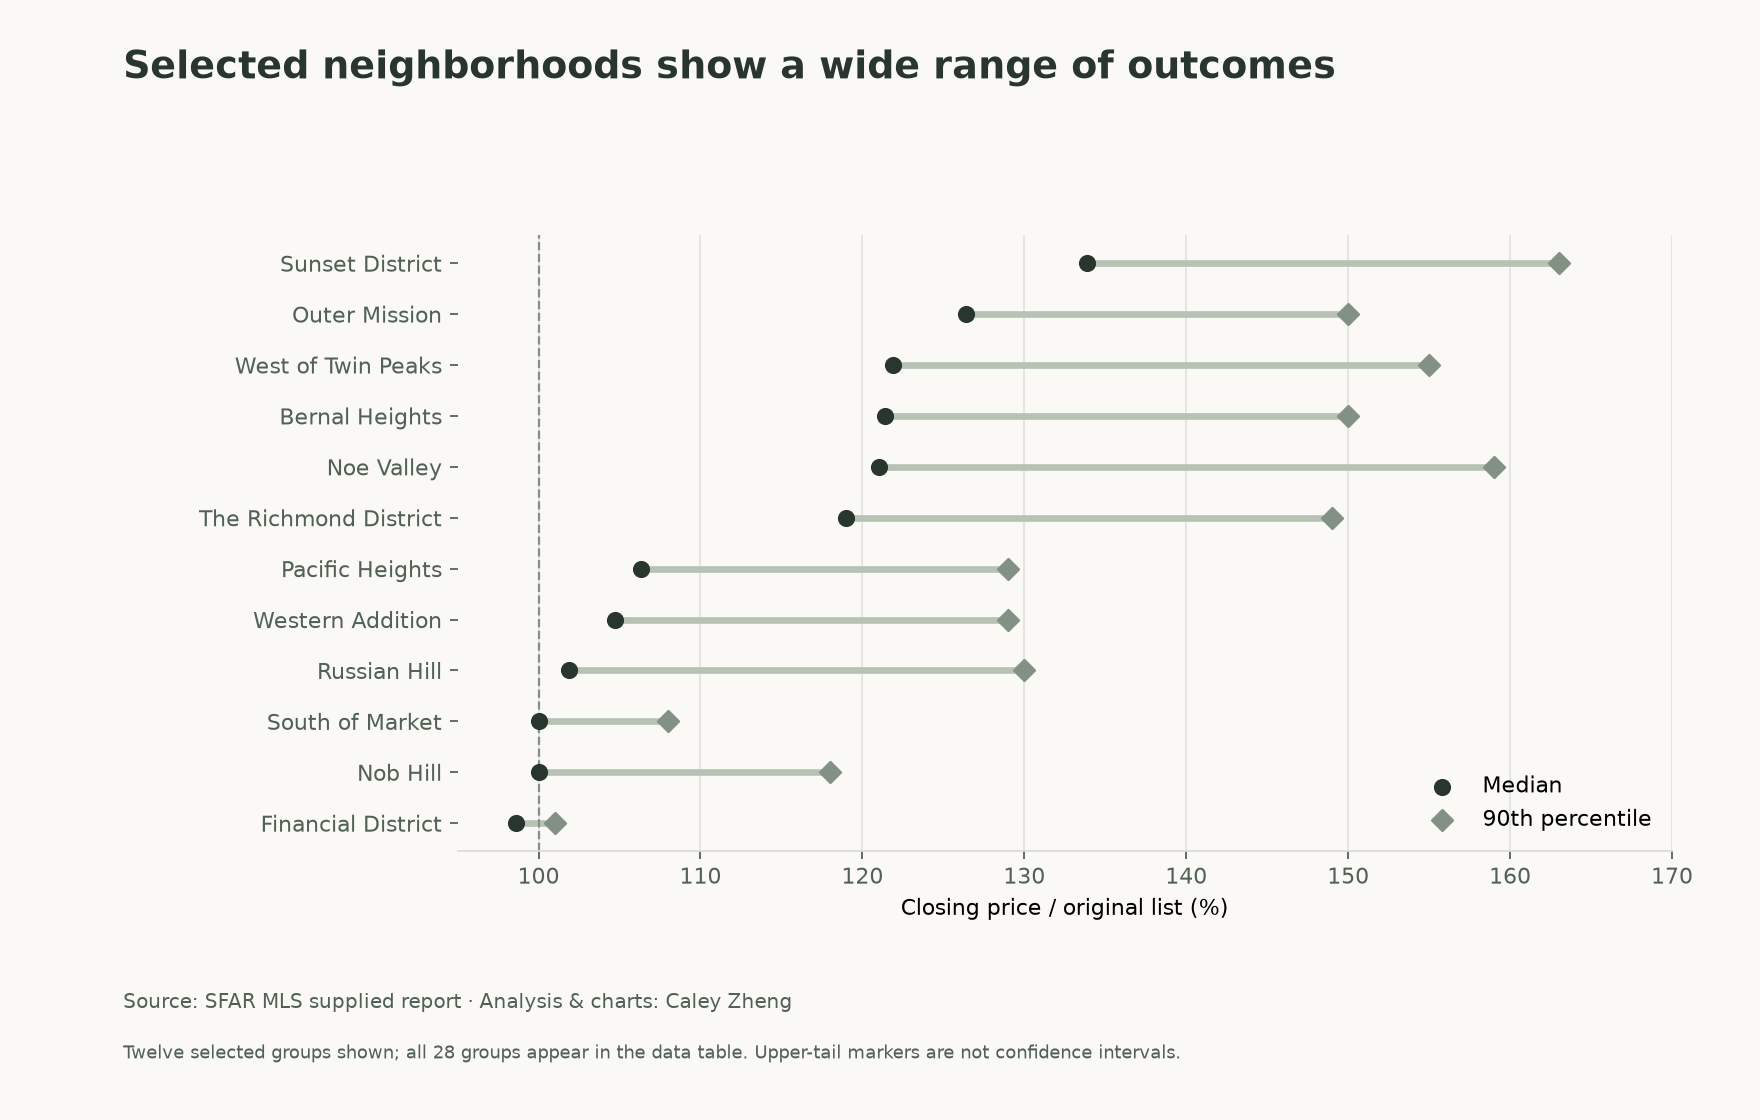
Selected neighborhoods show a wide range of outcomes
View chart data and downloads
| Neighborhood group | Sales | Median close / original list | Share over ask | 90th percentile close / list | Median days on market | Median closing price |
|---|---|---|---|---|---|---|
| Sunset District | 429 | 133.9% | 89% | 163% | 12 | $1,850,000 |
| Outer Mission | 136 | 126.4% | 91% | 150% | 12 | $1,507,500 |
| West of Twin Peaks | 167 | 121.9% | 89% | 155% | 10 | $2,610,000 |
| Bernal Heights | 176 | 121.4% | 88% | 150% | 13 | $1,732,500 |
| Glen Park | 51 | 121.1% | 86% | 156% | 12 | $2,355,000 |
| Noe Valley | 174 | 121.0% | 83% | 159% | 11 | $2,455,534 |
| Excelsior | 139 | 120.1% | 88% | 140% | 13 | $1,215,000 |
| The Richmond District | 290 | 119.0% | 87% | 149% | 12 | $2,128,440 |
| Haight-Ashbury | 124 | 118.8% | 89% | 147% | 12 | $1,925,500 |
| Eureka Valley | 228 | 117.7% | 82% | 143% | 13 | $1,862,500 |
| Presidio Heights | 45 | 114.2% | 78% | 143% | 10 | $3,000,000 |
| Oceanview | 111 | 113.7% | 75% | 137% | 14 | $1,300,000 |
| Twin Peaks | 51 | 113.5% | 75% | 139% | 14 | $1,683,000 |
| Lakeshore | 58 | 113.0% | 86% | 137% | 14 | $1,832,500 |
| Visitacion Valley | 54 | 109.9% | 85% | 134% | 18 | $1,100,000 |
| The Marina | 153 | 108.9% | 73% | 138% | 13 | $2,200,000 |
| Potrero Hill | 154 | 107.8% | 75% | 139% | 13 | $1,360,500 |
| Pacific Heights | 176 | 106.3% | 66% | 129% | 12 | $2,032,000 |
| Inner Mission | 223 | 106.1% | 65% | 136% | 21 | $1,269,000 |
| Western Addition | 280 | 104.7% | 62% | 129% | 14 | $1,302,500 |
| Russian Hill | 116 | 101.9% | 58% | 130% | 15 | $1,612,500 |
| Diamond Heights | 53 | 101.6% | 58% | 128% | 23 | $960,000 |
| North Beach | 88 | 101.2% | 59% | 114% | 15 | $1,140,000 |
| South of Market | 468 | 100.0% | 32% | 108% | 26 | $942,500 |
| Nob Hill | 135 | 100.0% | 44% | 118% | 27 | $1,180,000 |
| Downtown / Civic Center | 106 | 100.0% | 40% | 110% | 40 | $582,000 |
| Bayview | 111 | 100.0% | 50% | 124% | 28 | $848,000 |
| Financial District | 126 | 98.6% | 15% | 101% | 44 | $1,835,000 |
The groups in between show why I would tighten the comparison before writing an offer. Outer Mission’s median ratio was 126.4%, Noe Valley’s was 121.0%, and the Richmond group’s was 119.0%. Pacific Heights came in at 106.3% and Western Addition at 104.7%. These broad groups mix different properties and asking-price decisions. A neighborhood label does not make a house and a condo interchangeable.
At 100.0%, South of Market, Nob Hill, Downtown/Civic Center, and Bayview each had a median closing at original ask. Their shares above asking were quite different: 32%, 44%, 40%, and 50%, respectively. Even an identical median ratio can hide a different distribution of outcomes.
For block-level context, my Hayes Valley buyer’s guide, NoPa neighborhood guide, and Mission Dolores guide are useful next steps. San Francisco Real Estate Company’s neighborhood market reports provide another comparison, with their own sources and boundaries. I also check San Francisco’s Property Information Map when the usable space or property records need a closer look.
View all 28 neighborhood groups
| Neighborhood group | Sales | Median close / original list | Share over ask | 90th percentile close / list | Median days on market | Median closing price |
|---|---|---|---|---|---|---|
| Sunset District | 429 | 133.9% | 89% | 163% | 12 | $1,850,000 |
| Outer Mission | 136 | 126.4% | 91% | 150% | 12 | $1,507,500 |
| West of Twin Peaks | 167 | 121.9% | 89% | 155% | 10 | $2,610,000 |
| Bernal Heights | 176 | 121.4% | 88% | 150% | 13 | $1,732,500 |
| Glen Park | 51 | 121.1% | 86% | 156% | 12 | $2,355,000 |
| Noe Valley | 174 | 121.0% | 83% | 159% | 11 | $2,455,534 |
| Excelsior | 139 | 120.1% | 88% | 140% | 13 | $1,215,000 |
| The Richmond District | 290 | 119.0% | 87% | 149% | 12 | $2,128,440 |
| Haight-Ashbury | 124 | 118.8% | 89% | 147% | 12 | $1,925,500 |
| Eureka Valley | 228 | 117.7% | 82% | 143% | 13 | $1,862,500 |
| Presidio Heights | 45 | 114.2% | 78% | 143% | 10 | $3,000,000 |
| Oceanview | 111 | 113.7% | 75% | 137% | 14 | $1,300,000 |
| Twin Peaks | 51 | 113.5% | 75% | 139% | 14 | $1,683,000 |
| Lakeshore | 58 | 113.0% | 86% | 137% | 14 | $1,832,500 |
| Visitacion Valley | 54 | 109.9% | 85% | 134% | 18 | $1,100,000 |
| The Marina | 153 | 108.9% | 73% | 138% | 13 | $2,200,000 |
| Potrero Hill | 154 | 107.8% | 75% | 139% | 13 | $1,360,500 |
| Pacific Heights | 176 | 106.3% | 66% | 129% | 12 | $2,032,000 |
| Inner Mission | 223 | 106.1% | 65% | 136% | 21 | $1,269,000 |
| Western Addition | 280 | 104.7% | 62% | 129% | 14 | $1,302,500 |
| Russian Hill | 116 | 101.9% | 58% | 130% | 15 | $1,612,500 |
| Diamond Heights | 53 | 101.6% | 58% | 128% | 23 | $960,000 |
| North Beach | 88 | 101.2% | 59% | 114% | 15 | $1,140,000 |
| South of Market | 468 | 100.0% | 32% | 108% | 26 | $942,500 |
| Nob Hill | 135 | 100.0% | 44% | 118% | 27 | $1,180,000 |
| Downtown / Civic Center | 106 | 100.0% | 40% | 110% | 40 | $582,000 |
| Bayview | 111 | 100.0% | 50% | 124% | 28 | $848,000 |
| Financial District | 126 | 98.6% | 15% | 101% | 44 | $1,835,000 |
4. The original asking-price band changes the comparison.
The report groups homes by original list price, not closing price. That matters when a home advertised below $1.5 million ultimately closes above it. It remains in its original asking-price band for this analysis.
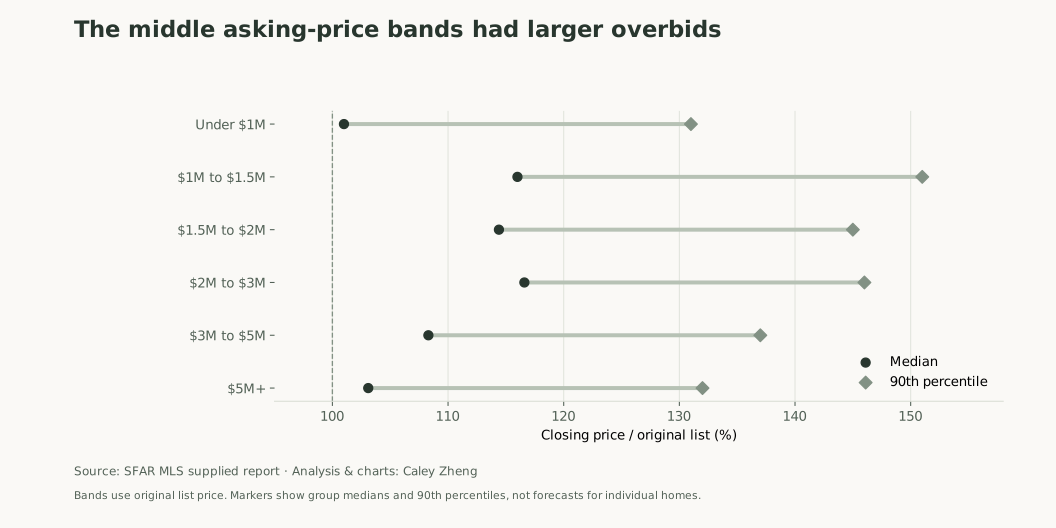
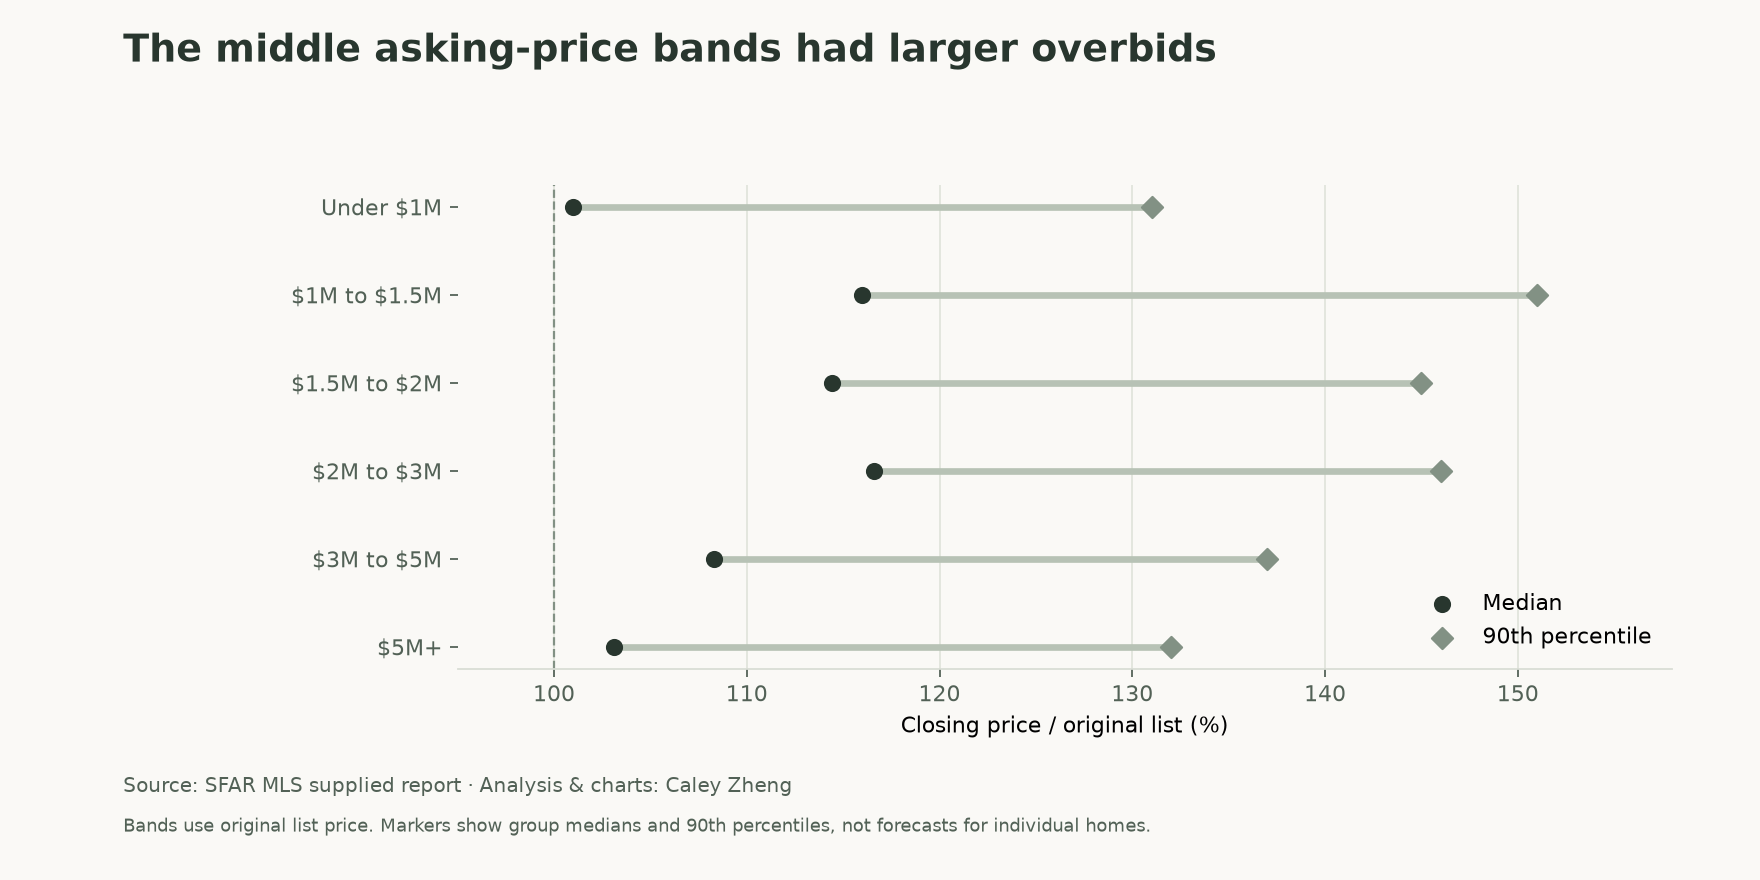
The $1 million to $1.5 million band had a median ratio of 116.0%; the $2 million to $3 million band was at 116.6%. Their median dollar premiums were $205,000 and $405,900. Under $1 million, the median premium was $6,000. At $5 million and above, it was $181,806, with a 103.1% median ratio.
The middle asking-price bands had larger overbids
View chart data and downloads
| Original list-price band | Sales | Median close / original list | Share over ask | 90th percentile close / list | Median days on market | Median dollars over ask |
|---|---|---|---|---|---|---|
| Under $1M | 1,443 | 101.0% | 55% | 131% | 22 | $6,000 |
| $1M to $1.5M | 1,327 | 116.0% | 78% | 151% | 13 | $205,000 |
| $1.5M to $2M | 776 | 114.4% | 76% | 145% | 12 | $255,000 |
| $2M to $3M | 515 | 116.6% | 79% | 146% | 12 | $405,900 |
| $3M to $5M | 270 | 108.3% | 71% | 137% | 12 | $325,000 |
| $5M+ | 156 | 103.1% | 54% | 132% | 13 | $181,806 |
I would not convert those figures into a quote for a particular listing. The $205,000 median belongs to the entire $1 million to $1.5 million group. It is not the measured premium for every home listed at $1.2 million. Similarly, applying the group’s 16% median ratio premium to a hypothetical $1.2 million asking price gives $192,000, which differs from the reported median dollar premium. The median of individual ratios and the median of individual dollar gaps are different statistics.
The 90th-percentile ratio is useful for understanding the upper end of the observed distribution. In the $1 million to $1.5 million band it was 151%, which would translate to $1.812 million on a hypothetical $1.2 million ask. That arithmetic illustrates the ratio; it does not establish a one-in-ten probability for that particular home or recommend that bid.
I would set an offer range from comparable closings, then check financing and cash requirements. The Consumer Financial Protection Bureau’s homebuying budget guide is a useful reminder to include costs beyond principal and interest. If the appraisal is below an agreed price, the financing deserves another review; the CFPB explains why valuation and purchase-price figures can differ.
5. The reported citywide ratios moved higher in 2026.
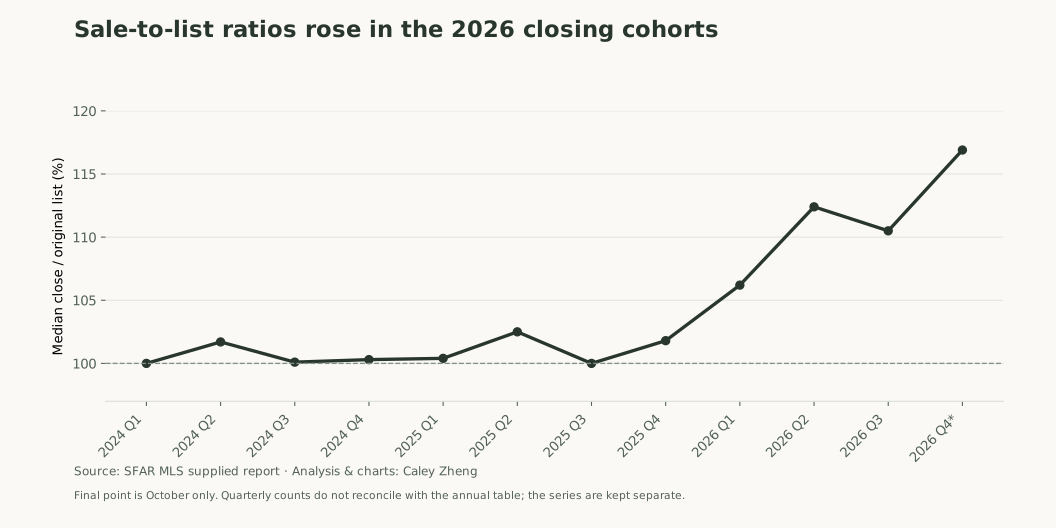
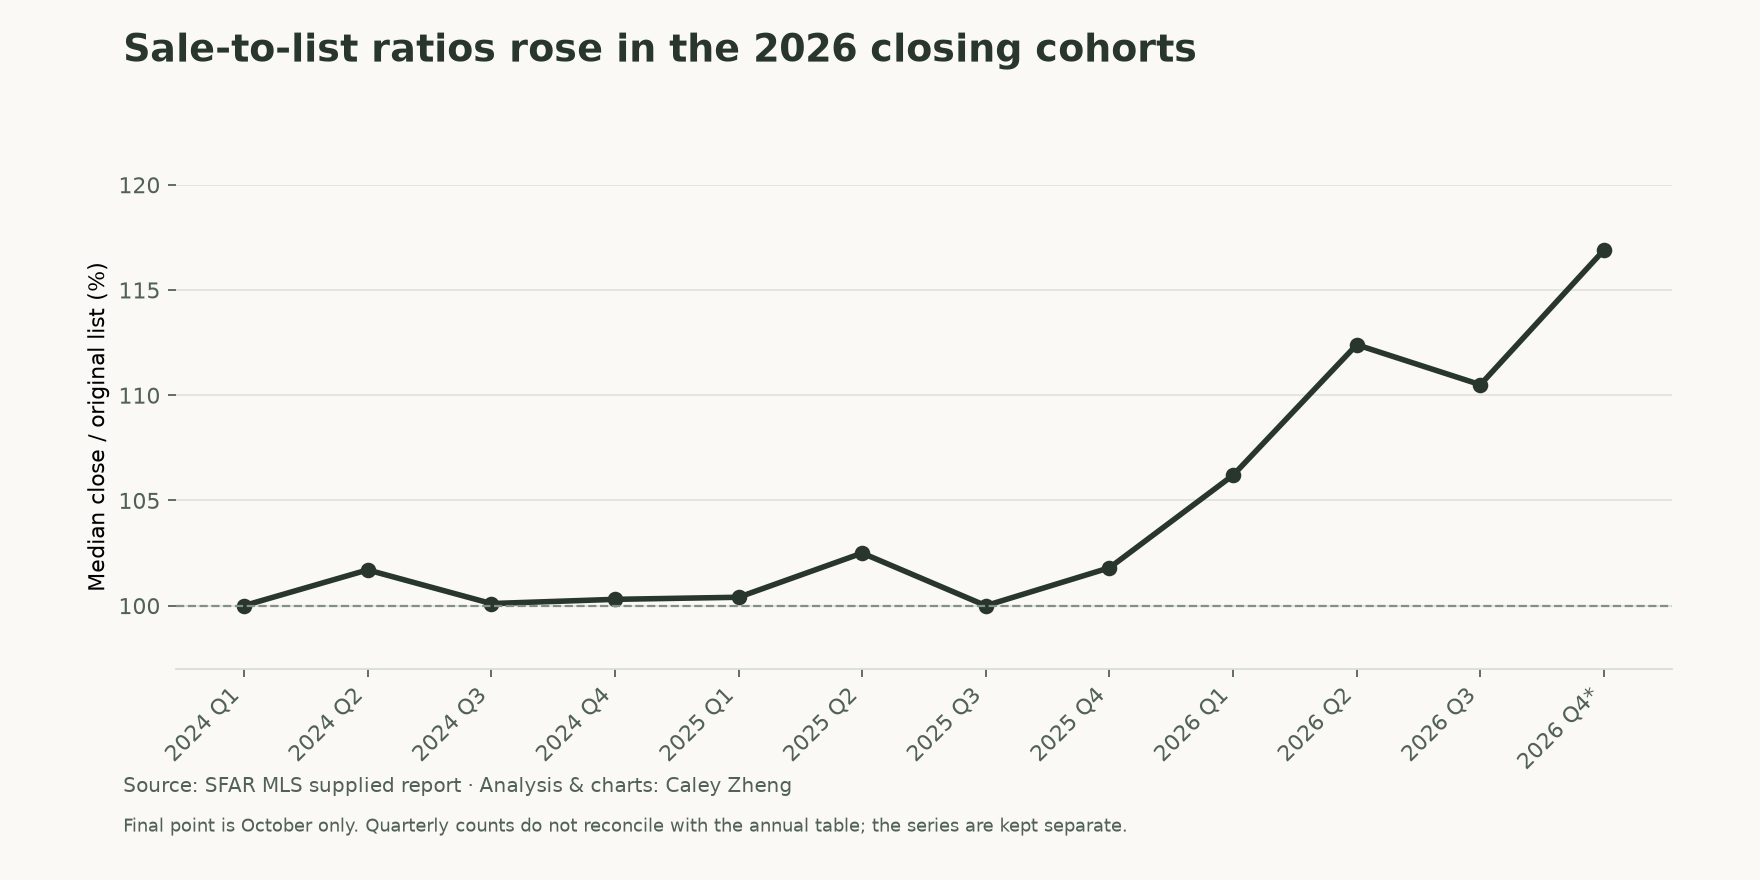
The quarterly table shows median ratios between 100.0% and 102.5% throughout 2024 and 2025. The 2026 figures were 106.2% in Q1, 112.4% in Q2, and 110.5% in Q3. The row labeled Q4 2026 covers October only and reports 116.9%, with 81% of sales above original ask.
Sale-to-list ratios rose in the 2026 closing cohorts
View chart data and downloads
| Quarter | Sales | Median close / original list | Share over original ask | Median days on market |
|---|---|---|---|---|
| 2024 Q1 | 802 | 100.0% | 44% | 21 |
| 2024 Q2 | 1,230 | 101.7% | 56% | 19 |
| 2024 Q3 | 949 | 100.1% | 51% | 22 |
| 2024 Q4 | 1,075 | 100.3% | 53% | 23 |
| 2025 Q1 | 885 | 100.4% | 52% | 19 |
| 2025 Q2 | 1,215 | 102.5% | 58% | 17 |
| 2025 Q3 | 1,031 | 100.0% | 50% | 23 |
| 2025 Q4 | 1,199 | 101.8% | 56% | 19 |
| 2026 Q1 | 821 | 106.2% | 66% | 13 |
| 2026 Q2 | 1,425 | 112.4% | 72% | 13 |
| 2026 Q3 | 1,062 | 110.5% | 72% | 13 |
| 2026 Q4 (Oct only) | 502 | 116.9% | 81% | 13 |
In the separate annual summary, 2026 YTD had a 110.9% median ratio and 72% of sales above ask, versus 101.3% and 54% in 2025. The reported median marketing period fell from 19 to 13 days. Those are signs of a different relationship between asking and closing prices in the recorded sales. They do not isolate whether the change came from stronger demand, lower launch prices, different properties selling, or a combination.
The annual median closing price also rose from $1.38 million in 2025 to $1.6 million in 2026 YTD. I would not call that appreciation of the same homes, because the sale mix changes and the periods have different lengths. My citywide multifamily analysis and Hayes Valley transaction study show why property type and the specific sample deserve attention before drawing a citywide conclusion.
The supplied quarterly sale counts do not reconcile with the annual totals for 2024, 2025, or 2026. I preserve the two tables separately rather than calculate a combined rate or invent a reason for the difference. The reconciliation notes below show the counts.
View the seven annual summary rows
| Year | Sales | Median close / original list | Share over ask | Share under ask | 90th percentile close / list | Median days on market | Median closing price |
|---|---|---|---|---|---|---|---|
| 2020 | 4,421 | 100.0% | 49% | 41% | 119% | 22 | $1,403,000 |
| 2021 | 6,384 | 103.9% | 61% | 31% | 128% | 16 | $1,435,000 |
| 2022 | 4,630 | 103.0% | 59% | 33% | 130% | 17 | $1,442,500 |
| 2023 | 3,503 | 100.0% | 45% | 47% | 118% | 25 | $1,308,000 |
| 2024 | 4,020 | 100.3% | 52% | 40% | 124% | 21 | $1,360,000 |
| 2025 | 4,299 | 101.3% | 54% | 38% | 128% | 19 | $1,380,000 |
| 2026 YTD | 3,782 | 110.9% | 72% | 21% | 145% | 13 | $1,600,000 |
6. A spectacular overbid still needs a valuation.
The report highlights three house sales with striking gaps to their original asking prices. 2162 14th Avenue was listed at $1.195 million and closed at $2.361 million, approximately 197.6% of ask. 128 Escolta Way closed at $1.88 million against $998,000, approximately 188.4%. 364 Day Street closed at $2.635 million against $898,000, approximately 293.4%.
That last number means about 193.4% above asking, not 293.4% above it. The distinction matters when a dramatic statistic starts making the rounds. These are selected examples from the supplied report; I have not independently reviewed their disclosures, full listing histories, or closing documents.
The ratios alone do not prove that a teaser-price strategy caused a strong result, or that the buyer overpaid relative to comparable homes. I want the actual property and competitive set before making either claim. San Francisco Real Estate Company’s asking-price strategy guide explains the distinction between estimated value, launch price, and a seller’s minimum acceptable result.
The same caution applies to a large discount. The report describes 188 Minna Street, unit 34D, closing at $2.625 million against an original $3.25 million ask after 224 days. That is roughly 80.8% of original list. It is a reason to investigate the unit, building, timing, and listing history. It does not tell us by itself whether the buyer secured a bargain.
7. How I would use this when buying or selling.
For a buyer, I start with comparable closed sales and a maximum all-in budget. I then use the relevant property type, neighborhood group, and price band to understand how the asking price might relate to the seller’s expectations. A high group ratio does not require abandoning the budget, and a median near asking does not guarantee negotiating room on a particular home.
The California Department of Real Estate’s homebuyer guidance recommends considering what other neighborhood properties sold for and reviewing the offer’s terms and contingencies. Price is only one part of a purchase. Condition, disclosures, financing, and contractual protections need their own attention. My off-market buying guide covers another situation where an advertised asking price may offer little help.
For a seller, I separate the likely value range from the launch strategy. A lower asking price may attract attention, but these closed-sale tables do not establish which strategy maximizes net proceeds for a comparable home. I would compare relevant listings, prepare the property and disclosures, review likely buyers, and agree on how offers will be evaluated. I would not promise a bidding war from the neighborhood median.
For a condo, I would pay particular attention to direct competition in the building and nearby buildings, HOA costs, assessments, and the buyer’s full carrying cost. The citywide median does not show whether a specific unit has unusual strengths or weaknesses. San Francisco Real Estate Company’s seller net-proceeds guide adds the cost side of the decision, which can matter as much as the headline sale price.
What I want this report to change is the first question we ask. Instead of “what percentage over asking should I offer?”, I would ask “what do the closest comparable sales support, and how does this listing’s price relate to that evidence?” That question gives us a stronger starting point for both the offer and the conversation that follows.
Send me the address if you would like to work through the comparable sales. You can also explore my featured transactions or browse more buying and selling insights.
Sources, definitions, and reconciliation notes
Data: SFAR MLS, supplied report dated November 4, 2026. Analysis and charts: Caley Zheng. The source covers closed San Francisco single-family residences, condominiums, TICs, and townhouses from January 1, 2020 through November 4, 2026, excluding sales below $200,000. Its seven annual rows sum to 31,039 reported closings. Raw transaction rows were not available for a new audit.
All sale-to-list figures use original asking price. The median is the middle of the recorded distribution; a 90th percentile describes its upper tail and is not a forecast for an individual property. Medians of dollar gaps and price ratios are calculated separately. Counts describe closed sales, not every home that was listed. Marketing time is the source’s days-on-market measure, not a count of days available before a buyer must submit an offer.
The source labels the neighborhood, price-band, and property-type tables as trailing twelve months. Its headings say November 2025 through October 2026, while the final methodology says November 1, 2025 through November 4, 2026. I call these the reported trailing-period tables and retain that uncertainty rather than assert an exact common end date. The price-band and property-type counts each total 4,487. The 28 published neighborhood groups, each with at least 40 sales, total 4,422; their composition is not assumed to match every other table.
Neighborhood names are the report’s MLS group labels. Boundary geometry and property-type composition by neighborhood were not supplied. Price bands refer to original list price. The 2026 annual row is incomplete, and Q4’s quarterly row is October only. Period lengths and property mixes differ, so the charts should not be read as a repeat-sales index or a causal test of a listing strategy.
View count discrepancies and editorial checks
The four quarterly counts sum to 4,056 for 2024, compared with 4,020 in the annual row; 4,330 for 2025, compared with 4,299; and 3,810 for 2026 through the row labeled October-only Q4, compared with 3,782 YTD in the annual row. The source does not explain the differences. No count, pooled share, or annual median was reconstructed from the quarterly figures.
The tables do not establish why individual sellers chose their asking prices, why particular buyers bid, or whether underpricing caused a higher net result. The 151% price-band illustration is $1.812 million on a hypothetical $1.2 million ask and does not supply an individual probability. The report’s specific addresses are selected illustrations, not independently verified recommendations or claims of client representation. The article creates no recurring update schedule.