When is the best time to sell a house in San Francisco? In this SFAR MLS analysis, February and March had the strongest historical price-per-square-foot results. March listings sold at an index level about 8.3% above November listings, after normalizing each sale against its listing year and property type. That is a useful planning signal, but it is not a promise that waiting until spring will increase your home's value.
Every fall, owners face a practical choice: list now or wait for spring. Familiar advice about serious holiday buyers and busy spring open houses only goes so far. To get a clearer answer, I looked at 27,398 closed San Francisco sales listed from 2020 through 2025, then compared that history with listings launched in 2026.
The calendar mattered, but the results were more nuanced than “spring good, fall bad.” September brought the largest share of listings that eventually sold and the weakest relative sale-to-list results. November and December had the lowest indexed prices per square foot. In the separate 2025 listing cohort, about a third of November listings were removed unsold. Then September 2026 produced unusually strong overbids among fast-closing sales.
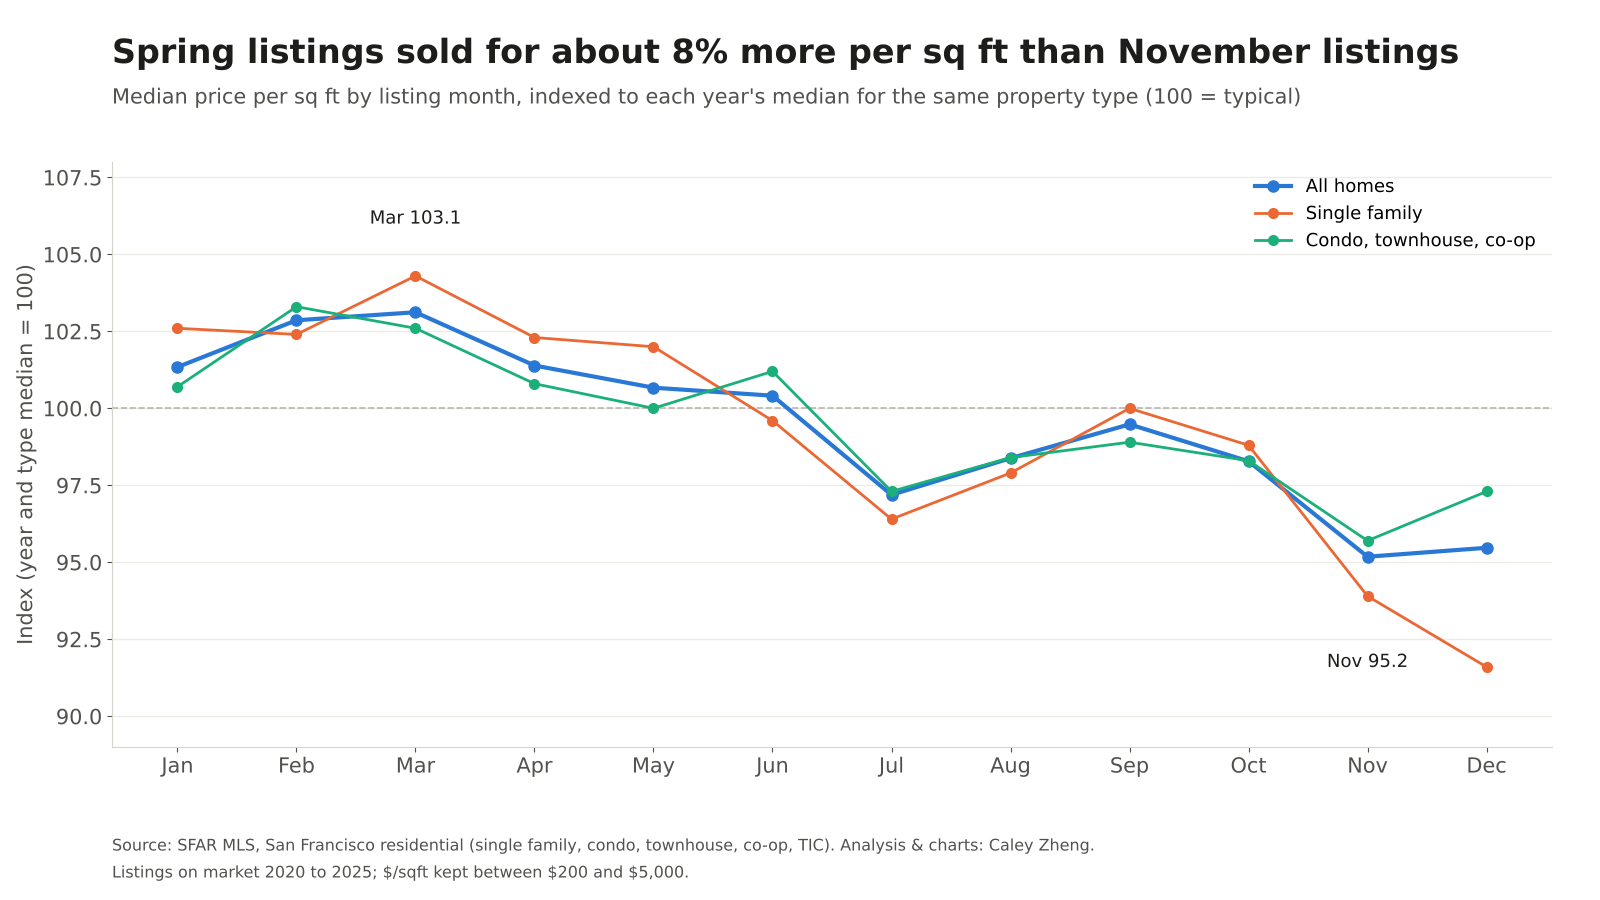
Spring listings sold for about 8% more per square foot
Asking prices reflect a marketing decision. To examine actual sale prices, I indexed each sale's price per square foot to the median for its own listing year and property type. A 2021 single-family sale is compared with other single-family sales listed in 2021. An index of 100 represents that group's median.
Among the 24,737 sales with usable price-per-square-foot data, March listings reached an index of 103.12, compared with 95.18 for November. Dividing those values gives a difference of about 8.3%. February was also strong at 102.86, while December was near November at 95.47.
Spring listings sold for about 8% more per square foot than November listings
View chart data and downloads
| list_month | all_n | all_index | sfr_n | sfr_index | condo_n | condo_index | tic_n | tic_index |
|---|---|---|---|---|---|---|---|---|
| Jan | 2178 | 101.34 | 835 | 102.6 | 1421 | 100.7 | 192 | 101.8 |
| Feb | 2262 | 102.86 | 948 | 102.4 | 1394 | 103.3 | 160 | 100.5 |
| Mar | 2355 | 103.12 | 1096 | 104.3 | 1357 | 102.6 | 150 | 102.0 |
| Apr | 2326 | 101.39 | 1086 | 102.3 | 1341 | 100.8 | 174 | 102.2 |
| May | 2420 | 100.67 | 1231 | 102.0 | 1327 | 100.0 | 116 | 98.1 |
| Jun | 2108 | 100.41 | 1037 | 99.6 | 1190 | 101.2 | 108 | 99.5 |
| Jul | 1951 | 97.19 | 910 | 96.4 | 1136 | 97.3 | 111 | 103.3 |
| Aug | 1799 | 98.38 | 869 | 97.9 | 1034 | 98.4 | 112 | 100.3 |
| Sep | 3386 | 99.48 | 1599 | 100.0 | 1895 | 98.9 | 245 | 100.2 |
| Oct | 2333 | 98.28 | 1202 | 98.8 | 1192 | 98.3 | 166 | 96.6 |
| Nov | 1097 | 95.18 | 566 | 93.9 | 556 | 95.7 | 79 | 95.2 |
| Dec | 522 | 95.47 | 271 | 91.6 | 255 | 97.3 | 37 | 99.1 |
The broad pattern appears within the property groups, too. Single-family homes listed in March had an index of 104.3, compared with 93.9 in November and 91.6 in December. Condos, townhouses, and co-ops reached 103.3 in February, compared with 95.7 in November. Late-year TIC samples were smaller, including just 37 December sales, so I would put less weight on those monthly readings.
This is an observed difference between groups of homes. The index accounts for year and property type, but it does not control for neighborhood, condition, size, views, renovations, or seller motivation. It is not a repeat-sales index or a causal estimate of what moving the same home's listing date would do.
A different mix of properties may explain part of the gap. So may changes in pricing and demand. The supplied data cannot tell us how much belongs to each explanation. For an individual seller, the useful next step is to compare the property's likely competition and recent comparable sales, then weigh any benefit of waiting against carrying costs and personal timing.
September brought the most listings and softer overbid results
September accounted for 3,739 of the 27,398 sold listings in the historical sample, or 13.6%. That made it the largest listing-month cohort, about 1.6 times an evenly distributed month's share. This measures listings that ultimately closed, rather than every new listing brought to market.
The larger September cohort also had softer results on several measures. Half sold above original asking, ahead of only December. September had the highest recorded price-cut share, 22.6%, and the longest median time on market, 24 days. Its sale-to-list result was about 0.8 percentage points below the comparison benchmark for the same year and property type.
My read is that September deserves careful competitive analysis. A larger launch cohort can give buyers more alternatives. But these historical associations do not establish that every September seller faces more competition, or that a particular home will sell for less.
Sale-to-list ratios also depend on where the asking price starts. An intentionally low list price can produce an impressive overbid without establishing a higher market value. My analysis of San Francisco sale prices versus list prices explains why pricing strategy matters when reading those percentages.
Download the monthly volume, price-cut, and time-on-market table to compare all twelve months.
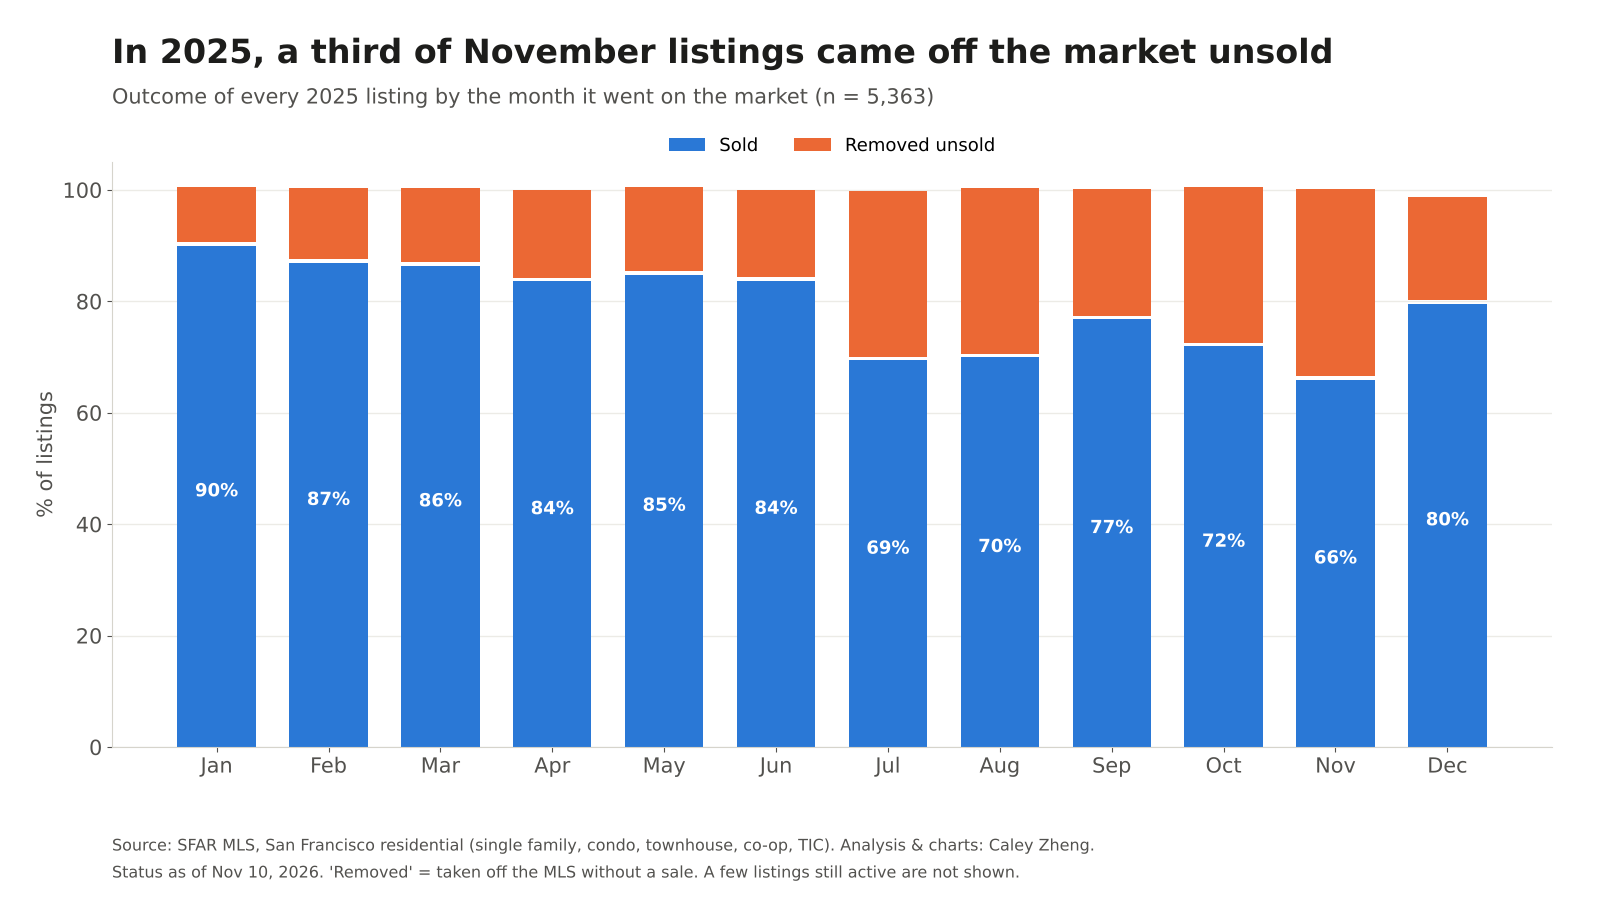
A third of November 2025 listings were removed unsold
Closed sales tell us what happened to listings that sold. They leave out those that came off the market. To examine that second group, I used a separate cohort of all 5,363 residential listings launched in 2025, with their status measured on November 10, 2026.
January listings had a 90.0% sold share. February through June ranged from 83.6% to 86.9%. The sold share fell to 69.4% in July and 70.0% in August, recovered to 76.8% in September, then fell to 71.9% in October and 65.9% in November. December reached 79.6%.
A third of November 2025 listings were removed unsold
View chart data and downloads
| list_month | listings_2025 | sold | removed | removed_then_relisted_within_180d | still_active | pct_sold | pct_removed |
|---|---|---|---|---|---|---|---|
| Jan | 479 | 431 | 48 | 8 | 0 | 90.0 | 10.0 |
| Feb | 412 | 358 | 53 | 4 | 1 | 86.9 | 12.9 |
| Mar | 508 | 439 | 68 | 7 | 1 | 86.4 | 13.4 |
| Apr | 555 | 464 | 87 | 14 | 4 | 83.6 | 15.7 |
| May | 551 | 467 | 83 | 12 | 1 | 84.8 | 15.1 |
| Jun | 398 | 333 | 62 | 8 | 3 | 83.7 | 15.6 |
| Jul | 356 | 247 | 106 | 10 | 3 | 69.4 | 29.8 |
| Aug | 414 | 290 | 123 | 21 | 1 | 70.0 | 29.7 |
| Sep | 812 | 624 | 184 | 44 | 4 | 76.8 | 22.7 |
| Oct | 516 | 371 | 145 | 52 | 0 | 71.9 | 28.1 |
| Nov | 249 | 164 | 84 | 27 | 1 | 65.9 | 33.7 |
| Dec | 113 | 90 | 21 | 8 | 2 | 79.6 | 18.6 |
Of November's 249 listings, 164 sold, 84 were removed unsold, and one remained active. The removed share was 33.7%. Twenty-seven of those 84 removed listings were flagged as having a subsequent listing under the supplied 180-day relisting query.
A removal does not necessarily mean the property could never sell. Owners may change plans, pause marketing, or relaunch under a new listing ID. These are listing-level outcomes, not a count of unique homes that permanently failed to find a buyer.
There is another useful distinction. Among November listings that did close in the 2020–2025 sample, just 13.2% recorded a price cut, the lowest monthly share. Their relative sale-to-list result was close to the year-and-type benchmark. Lower price-per-square-foot results did not come with more frequent recorded price reductions among those successful listings.
I would treat November as a month that rewards a realistic plan, while recognizing that this analysis cannot identify the cause of each removal. The sell-through comparison covers only 2025 because reliable removed-listing coverage begins in late 2024. One year's result is a planning signal, not a permanent failure rate.
September 2026 broke the historical pattern
The 2020–2025 averages are a starting point. The 2026 results show why they cannot be a fixed rule.
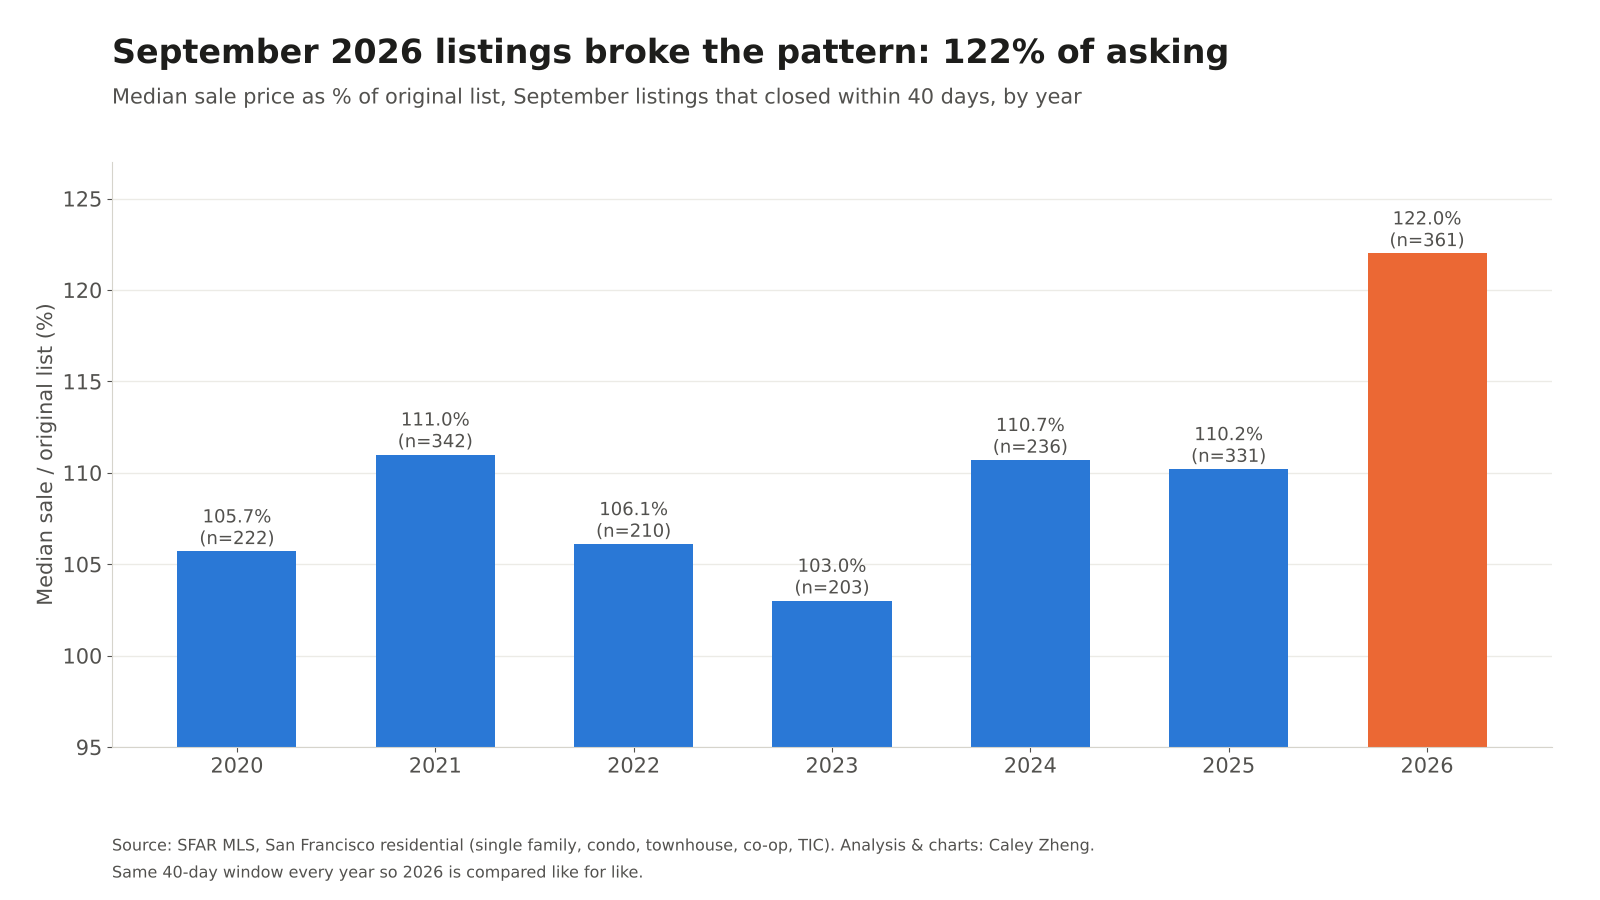
For a more comparable September check, I isolated listings that closed within 40 calendar days of going on the market, using the same window in every year. Among the 361 qualifying September 2026 sales, the median sale price was 122.0% of original asking, or 22% above it. About 92% sold over asking.
The prior six September fast-close cohorts ranged from 103.0% of original asking in 2023 to 111.0% in 2021. The 2026 result was substantially higher within this specific subset.
September 2026 fast closes reached 122% of original asking
View chart data and downloads
| list_year | n_closed_within_40_days | median_sale_to_list_pct | pct_sold_over_asking |
|---|---|---|---|
| 2020 | 222 | 105.7 | 76.1 |
| 2021 | 342 | 111.0 | 85.4 |
| 2022 | 210 | 106.1 | 73.3 |
| 2023 | 203 | 103.0 | 68.0 |
| 2024 | 236 | 110.7 | 81.4 |
| 2025 | 331 | 110.2 | 80.4 |
| 2026 | 361 | 122.0 | 92.0 |
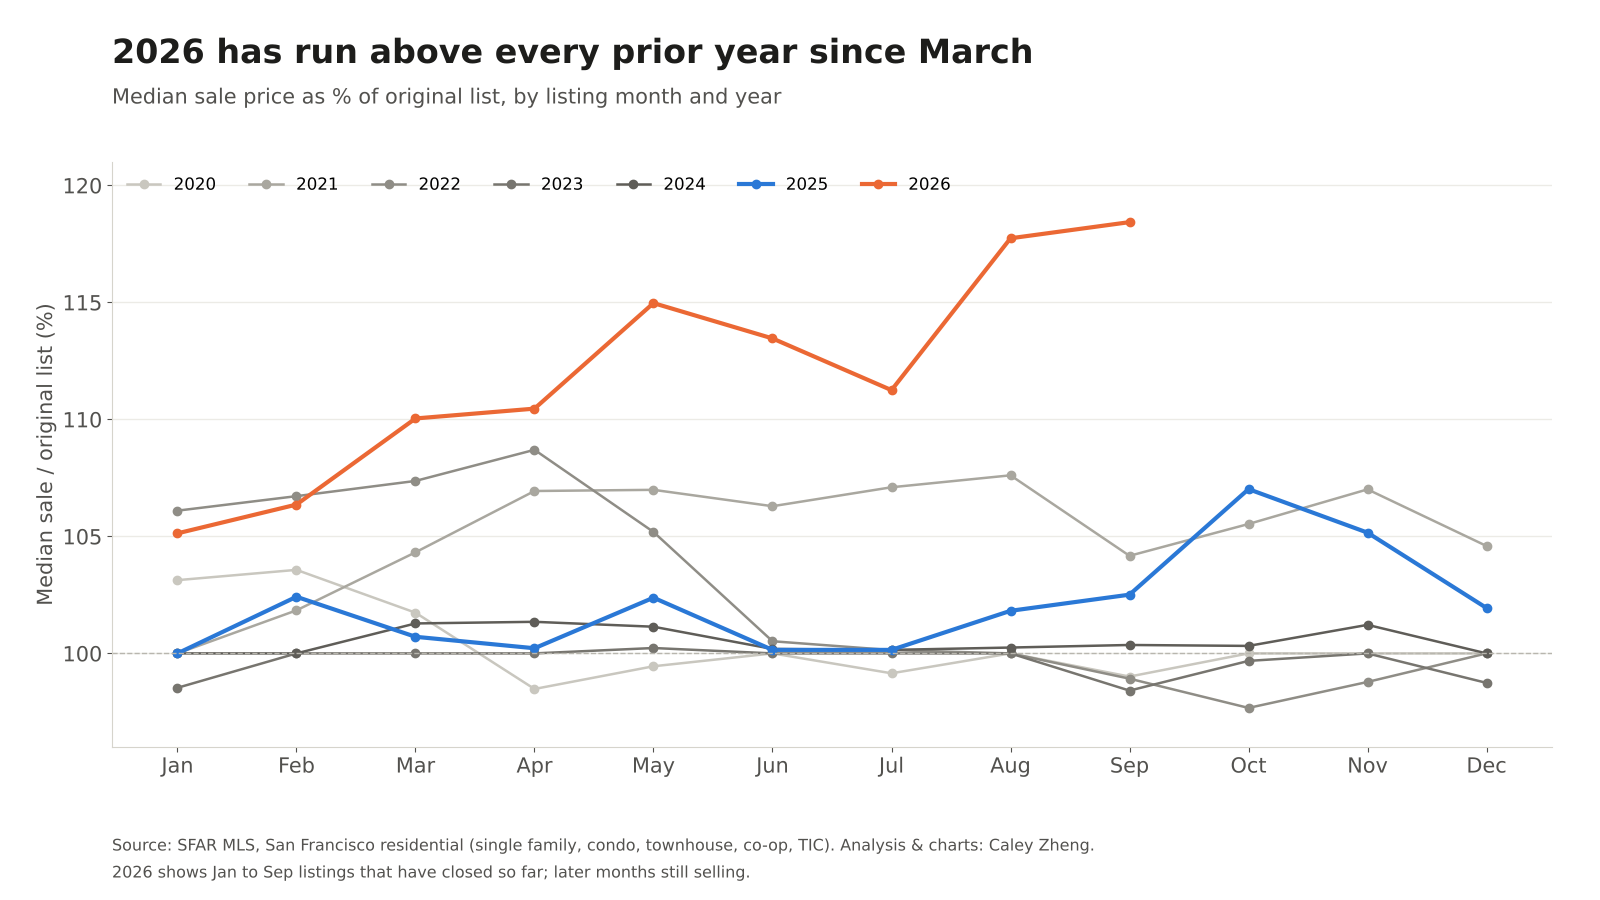
The broader monthly chart tells a similar story about overbids: for listings launched from March through September, the 2026 median sale-to-original-list ratio was above the corresponding month in every year from 2020 through 2025. August and September were particularly strong among the sales that had closed.
2026 sale-to-list ratios led prior years from March through September
View chart data and downloads
| list_year | list_month | n | median_sale_to_original_list_pct |
|---|---|---|---|
| 2020 | Jan | 355 | 103.13 |
| 2020 | Feb | 386 | 103.57 |
| 2020 | Mar | 220 | 101.74 |
| 2020 | Apr | 203 | 98.48 |
| 2020 | May | 398 | 99.45 |
| 2020 | Jun | 485 | 100.0 |
| 2020 | Jul | 560 | 99.15 |
| 2020 | Aug | 532 | 100.0 |
| 2020 | Sep | 678 | 99.01 |
| 2020 | Oct | 622 | 100.0 |
| 2020 | Nov | 325 | 100.0 |
| 2020 | Dec | 152 | 100.0 |
| 2021 | Jan | 533 | 100.0 |
| 2021 | Feb | 541 | 101.84 |
| 2021 | Mar | 563 | 104.32 |
| 2021 | Apr | 617 | 106.94 |
| 2021 | May | 573 | 106.99 |
| 2021 | Jun | 568 | 106.29 |
| 2021 | Jul | 514 | 107.1 |
| 2021 | Aug | 399 | 107.61 |
| 2021 | Sep | 795 | 104.17 |
| 2021 | Oct | 575 | 105.53 |
| 2021 | Nov | 259 | 107.01 |
| 2021 | Dec | 114 | 104.59 |
| 2022 | Jan | 442 | 106.1 |
| 2022 | Feb | 510 | 106.72 |
| 2022 | Mar | 599 | 107.37 |
| 2022 | Apr | 508 | 108.7 |
| 2022 | May | 452 | 105.19 |
| 2022 | Jun | 384 | 100.52 |
| 2022 | Jul | 318 | 100.14 |
| 2022 | Aug | 279 | 100.0 |
| 2022 | Sep | 525 | 98.92 |
| 2022 | Oct | 313 | 97.67 |
| 2022 | Nov | 156 | 98.78 |
| 2022 | Dec | 70 | 100.0 |
| 2023 | Jan | 316 | 98.53 |
| 2023 | Feb | 308 | 100.0 |
| 2023 | Mar | 372 | 100.0 |
| 2023 | Apr | 358 | 100.0 |
| 2023 | May | 333 | 100.23 |
| 2023 | Jun | 269 | 100.0 |
| 2023 | Jul | 246 | 100.0 |
| 2023 | Aug | 235 | 100.0 |
| 2023 | Sep | 540 | 98.41 |
| 2023 | Oct | 327 | 99.68 |
| 2023 | Nov | 135 | 100.0 |
| 2023 | Dec | 59 | 98.74 |
| 2024 | Jan | 375 | 100.0 |
| 2024 | Feb | 399 | 100.0 |
| 2024 | Mar | 413 | 101.28 |
| 2024 | Apr | 453 | 101.35 |
| 2024 | May | 452 | 101.14 |
| 2024 | Jun | 297 | 100.19 |
| 2024 | Jul | 273 | 100.15 |
| 2024 | Aug | 283 | 100.25 |
| 2024 | Sep | 579 | 100.36 |
| 2024 | Oct | 354 | 100.32 |
| 2024 | Nov | 162 | 101.22 |
| 2024 | Dec | 78 | 100.0 |
| 2025 | Jan | 427 | 100.0 |
| 2025 | Feb | 358 | 102.42 |
| 2025 | Mar | 436 | 100.71 |
| 2025 | Apr | 462 | 100.22 |
| 2025 | May | 466 | 102.38 |
| 2025 | Jun | 332 | 100.15 |
| 2025 | Jul | 246 | 100.15 |
| 2025 | Aug | 287 | 101.82 |
| 2025 | Sep | 622 | 102.51 |
| 2025 | Oct | 369 | 107.02 |
| 2025 | Nov | 164 | 105.16 |
| 2025 | Dec | 90 | 101.94 |
| 2026 | Jan | 360 | 105.13 |
| 2026 | Feb | 350 | 106.36 |
| 2026 | Mar | 518 | 110.04 |
| 2026 | Apr | 514 | 110.46 |
| 2026 | May | 474 | 114.97 |
| 2026 | Jun | 305 | 113.46 |
| 2026 | Jul | 274 | 111.25 |
| 2026 | Aug | 298 | 117.74 |
| 2026 | Sep | 426 | 118.43 |
Two limits matter. First, the 2026 monthly cohorts are incomplete. Later listings had less time to close, so the recorded sales can favor faster transactions. Second, applying the same 40-day window improves the comparison of fast closers but still excludes slower sales and unsold listings. It does not control for property mix or asking-price strategy.
These charts show unusually strong sale-to-list results. They do not prove that all San Francisco home values rose by the same amount, or explain what caused the change. For buyers and sellers, the practical lesson is that current comparable sales deserve more weight than an assumption about the season.
How buyers and sellers can use the listing calendar
For sellers with flexible timing
February and March had the strongest historical indexed price-per-square-foot results. If your home can be fully prepared for that window, spring deserves consideration. Work backward from a launch date to allow time for inspections, repairs, disclosures, presentation, and pricing.
Do not assume the measured 8.3% gap is a return you can earn by waiting. Compare the costs of holding the property, the condition it will be in at launch, and competing homes that buyers are likely to see. A well-prepared home at a realistic price may be a better decision now than a costly delay for an uncertain seasonal benefit.
For sellers ready in the fall
November does not automatically mean accepting a discount. Successful November listings had relatively few recorded price cuts in the historical sample. The larger concern in the 2025 cohort was the share removed unsold. Build a pricing and marketing plan that fits current evidence, and agree on how you will respond if buyer interest is weak.
For buyers comparing spring and fall
Historically, September represented the largest cohort of listings that eventually sold, and late-fall listings had lower indexed prices per square foot. Those patterns can guide when to watch closely, but they do not guarantee a bargain. September 2026 fast closers are a clear example.
Evaluate each home's comparable sales, condition, disclosures, and time on market. A large overbid may reflect a low asking price. A lower price per square foot may reflect work the property needs. For another part of the search, read how off-market listings work in San Francisco.
For owners and investors
The calendar should sit alongside carrying costs, financing, occupancy, and property type. If you own a TIC, the ownership format may matter more than the listing month. My analysis of the San Francisco TIC discount versus condos puts that separate pricing question in context.
Common questions about when to sell in San Francisco
What is the best month to sell a house in San Francisco?
March had the highest all-home indexed price per square foot in this 2020–2025 listing-month sample, with February close behind. The best month for a specific home depends on readiness, comparable sales, competition, and the owner's costs and timetable.
Is November a bad time to list?
It carries tradeoffs. November had a lower historical price-per-square-foot index and the lowest sold share in the separate 2025 cohort. However, November listings that sold had the lowest recorded price-cut rate in the historical sample. Neither result determines an individual property's outcome.
Does selling for 122% of asking mean prices rose 22%?
No. It means the median sale-to-original-list ratio was 122% among the September 2026 listings that closed within 40 days. It compares sale prices with those homes' asking prices, not with their prior values or last year's comparable sales.
Methodology and source data
Source and scope. This article uses the supplied SFAR MLS analysis and charts credited to Caley Zheng, extracted November 10, 2026. Geography is San Francisco. Property types are single-family residences, condominiums, townhouses, stock cooperatives, and tenancies in common. Listing month refers to the on-market date, not the closing date.
Samples. The historical sample includes 27,398 closed sales listed from January 2020 through December 2025. Of those, 24,737 have price-per-square-foot observations within the analysis range. The supplied draft reports 3,519 closed sales listed January–September 2026. The separate outcomes cohort includes all 5,363 listings launched in 2025, with status as of November 10, 2026.
Closed-sale filters. The supplied queries exclude future close dates, require close prices between $100,000 and $50 million and a positive original list price, and limit sale-to-original-list ratios to 0.5–2.0. The main historical analysis limits days on market to 0–730. Price per square foot is used only between $200 and $5,000. The September fast-close query uses closing within 40 calendar days of the on-market date and does not include the separate days-on-market filter.
Definitions. Sale-to-list means close price divided by original list price. A price cut means the recorded final list price was below original list on that listing. The price-per-square-foot index divides each eligible observation by its listing-year and property-type median, then takes the monthly median. The March–November comparison is 103.12 ÷ 95.18 − 1, approximately 8.3%. Other metrics are not all medians: listing shares and price-cut shares are proportions.
Removed listings and relists. Removed means taken off the MLS without a sale on that listing. The supplied query flags a different listing ID for the same property with a later on-market date within 180 days of the recorded off-market date, falling back to the original on-market date if needed. Relisting is not proof of a later sale. Multiple listing IDs can describe the same property.
Limits. The analysis is observational and does not control for condition, neighborhood, seller motivation, marketing, or all differences in property mix. Recent cohorts remain incomplete. Removed-listing coverage supports a full-year comparison for 2025 only. The article checks the supplied summary tables and query definitions; the underlying MLS records were not independently rerun for this publication.
Download the supplied analysis queries. Each chart also includes its original data table and CSV download. Source tables are provided for transparency, subject to the limitations above.
Have a property in mind? Talk to Caley about your listing timeline. We can compare the relevant sales and competing homes, then build a plan around your property and priorities.
Working through a TIC decision? The TIC learning center connects the ownership, financing, costs, and buyer-diligence guides.