A duplex and a 20-unit building can share a block without sharing a market.
That is where I start when someone asks what higher interest rates have done to Hayes Valley multifamily. The apartment investor needs the rent roll to support the debt. The small-building buyer may also be buying a place to live. Both care about the monthly payment. They can still arrive at very different prices.
I own and operate small apartment buildings in San Francisco, so this is a corner of the market I watch closely. For this analysis, I worked through a supplied SFAR MLS summary of 86 Residential Income closings from January 2020 through October 2026 around Hayes Valley and adjoining blocks. I separated two-to-four-unit buildings from properties with five or more units. Then I asked a narrower question than “did rates cause prices to fall?”: where does the financing pressure show up, and where does the sales mix complicate the answer?
1. The cost of money changed. The loan still needs its own analysis.
The Federal Reserve’s policy-rate history puts the cycle in perspective: near-zero overnight rates gave way to rapid tightening in 2022 and 2023. By July 2023, the target range was 5.25%–5.50%. Easing followed, but the Fed raised the range to 3.75%–4.00% in September 2026 and held it there in October.
The Fed rate is not a mortgage quote. For a fixed-rate apartment loan, Treasury yields, lender spreads, term, amortization, borrower strength, and the property’s income all matter. Freddie Mac’s multifamily Index Lock terms distinguish the Treasury benchmark from the spread. Floating debt can follow a different clock, including SOFR averages published by the New York Fed.
For a recent benchmark check, the 10-year Treasury series was 4.45% at the last common trading day of May, 5.29% at September’s end, and 4.94% at October’s end. October brought some relief, but the benchmark remained above May. I show that timeline and a worked debt-capacity example in my citywide multifamily financing analysis.
Here is the part that matters at the offer table: a property can satisfy a lender’s loan-to-value ceiling and still fail its cash-flow coverage test. Fannie Mae’s conventional multifamily framework lists a 1.25x minimum debt-service coverage ratio for eligible stabilized properties. That is a framework, not a promise that every building or borrower qualifies. I want a current property-specific quote, not a residential mortgage headline standing in for a commercial term sheet.
2. The cap-rate reset is real in the reported sample.
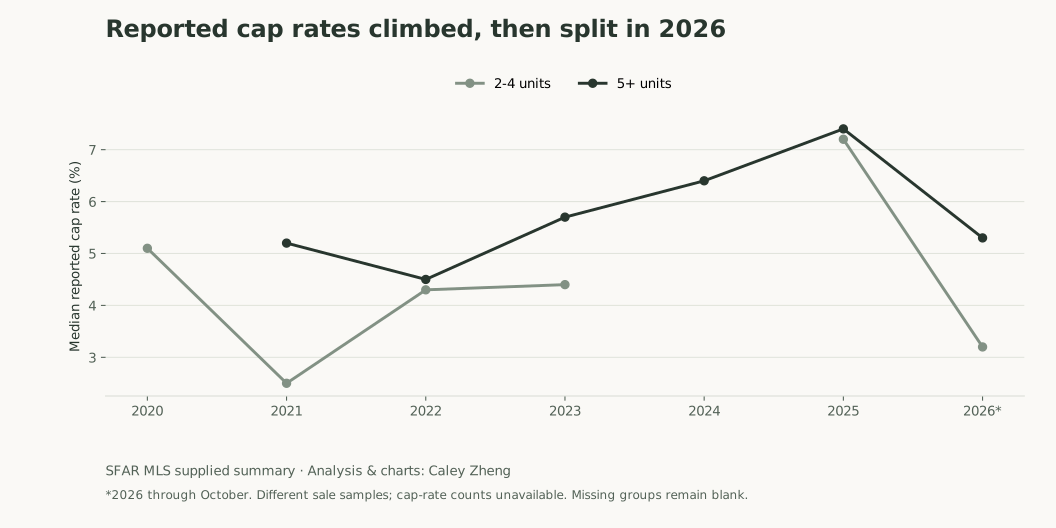
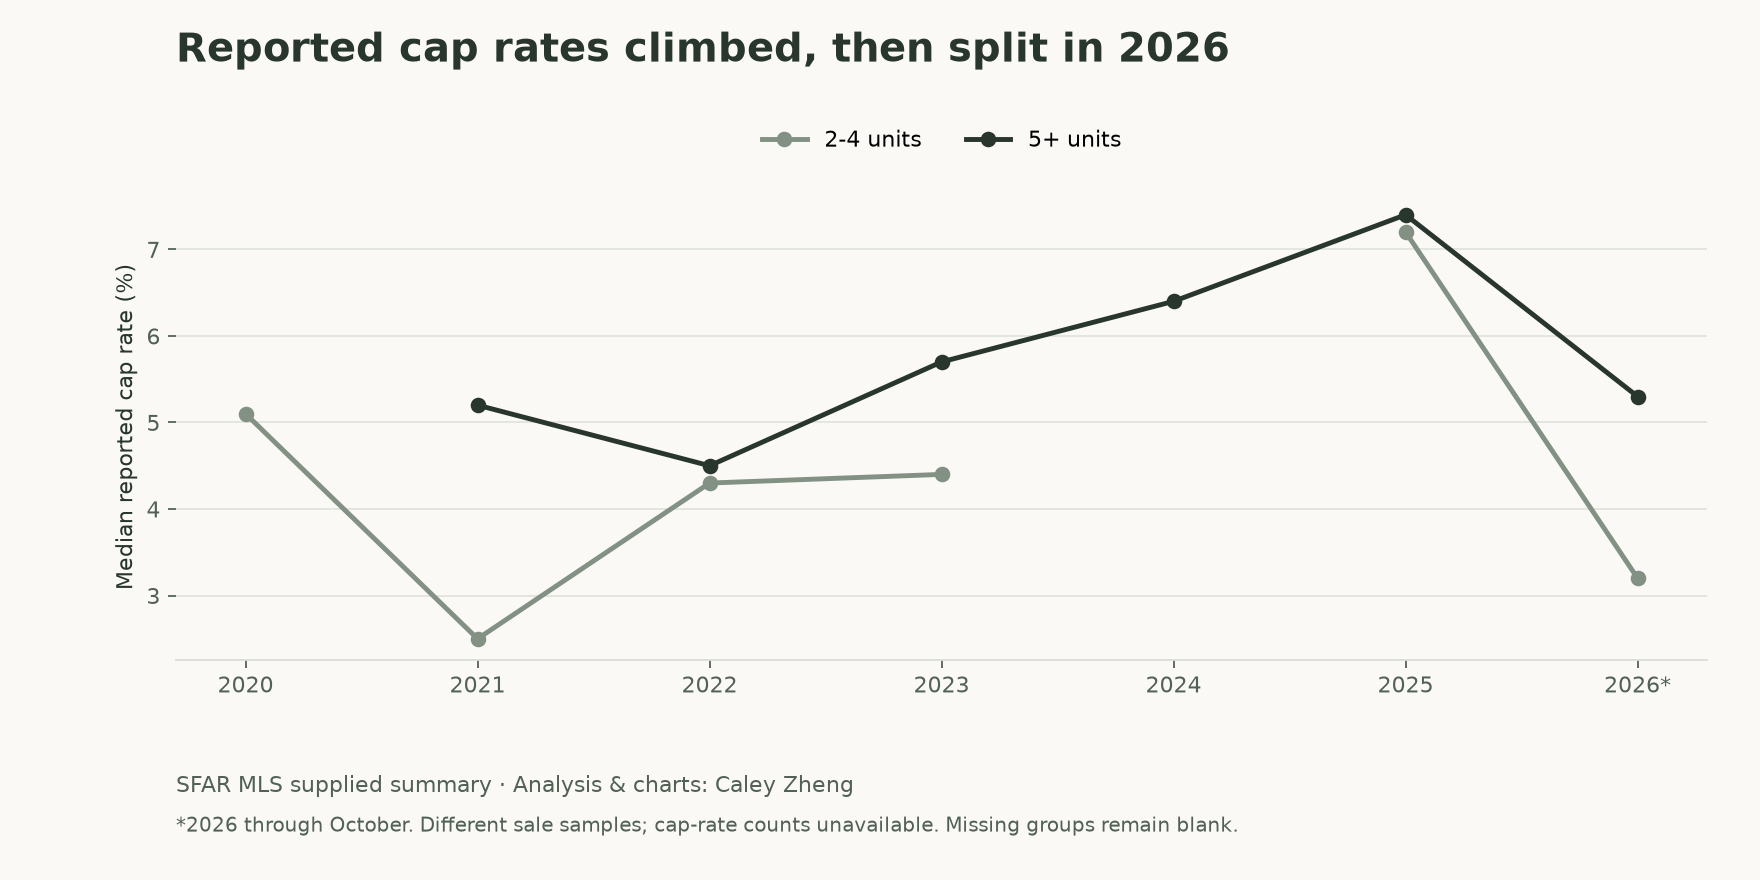
The median reported cap rate for five-plus-unit sales moved from 5.2% in 2021 to 7.4% in 2025, before falling to 5.3% in 2026 year to date. The annual large-building sale counts behind those figures are four, four, and seven. These are useful observations. They are also small groups of different buildings.
Reported cap rates climbed, then split in 2026
View chart data and downloads
| Year | Building size | Closed sales | Median cap rate |
|---|---|---|---|
| 2020 | 2-4 units | 8 | 5.1% |
| 2021 | 2-4 units | 16 | 2.5% |
| 2021 | 5+ units | 4 | 5.2% |
| 2022 | 2-4 units | 8 | 4.3% |
| 2022 | 5+ units | 1 | 4.5% |
| 2023 | 2-4 units | 9 | 4.4% |
| 2023 | 5+ units | 7 | 5.7% |
| 2024 | 2-4 units | 2 | n/a |
| 2024 | 5+ units | 7 | 6.4% |
| 2025 | 2-4 units | 5 | 7.2% |
| 2025 | 5+ units | 4 | 7.4% |
| 2026 YTD | 2-4 units | 8 | 3.2% |
| 2026 YTD | 5+ units | 7 | 5.3% |
Cap-rate arithmetic explains why an income buyer feels that change so directly. At a fixed $100,000 of annual net operating income, a 5.2% cap implies about $1.923 million of value. A 7.4% cap implies about $1.351 million, roughly 29.7% less. That is a sensitivity illustration holding income constant, not a measured 29.7% loss on the buildings in this dataset.
I do not assume those buildings had identical income, expenses, condition, or leases. The source does not include a matched-property income series or actual loan files. Interest rates offer a credible mechanism for tougher underwriting; these annual medians do not isolate a causal effect.
For a practical framework, San Francisco Real Estate Company’s investment-property evaluation guide is useful reading alongside this chart. Documented rent, operating expenses, reserves, and debt deserve separate lines in the model. “Great location” is important. It is not an operating-expense category.
3. The price story is more measured than the cap-rate story.
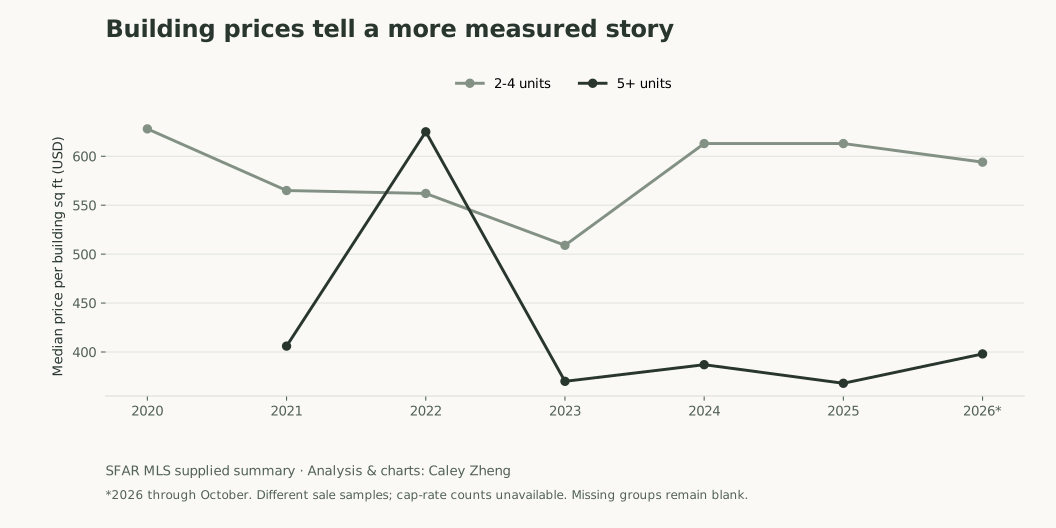
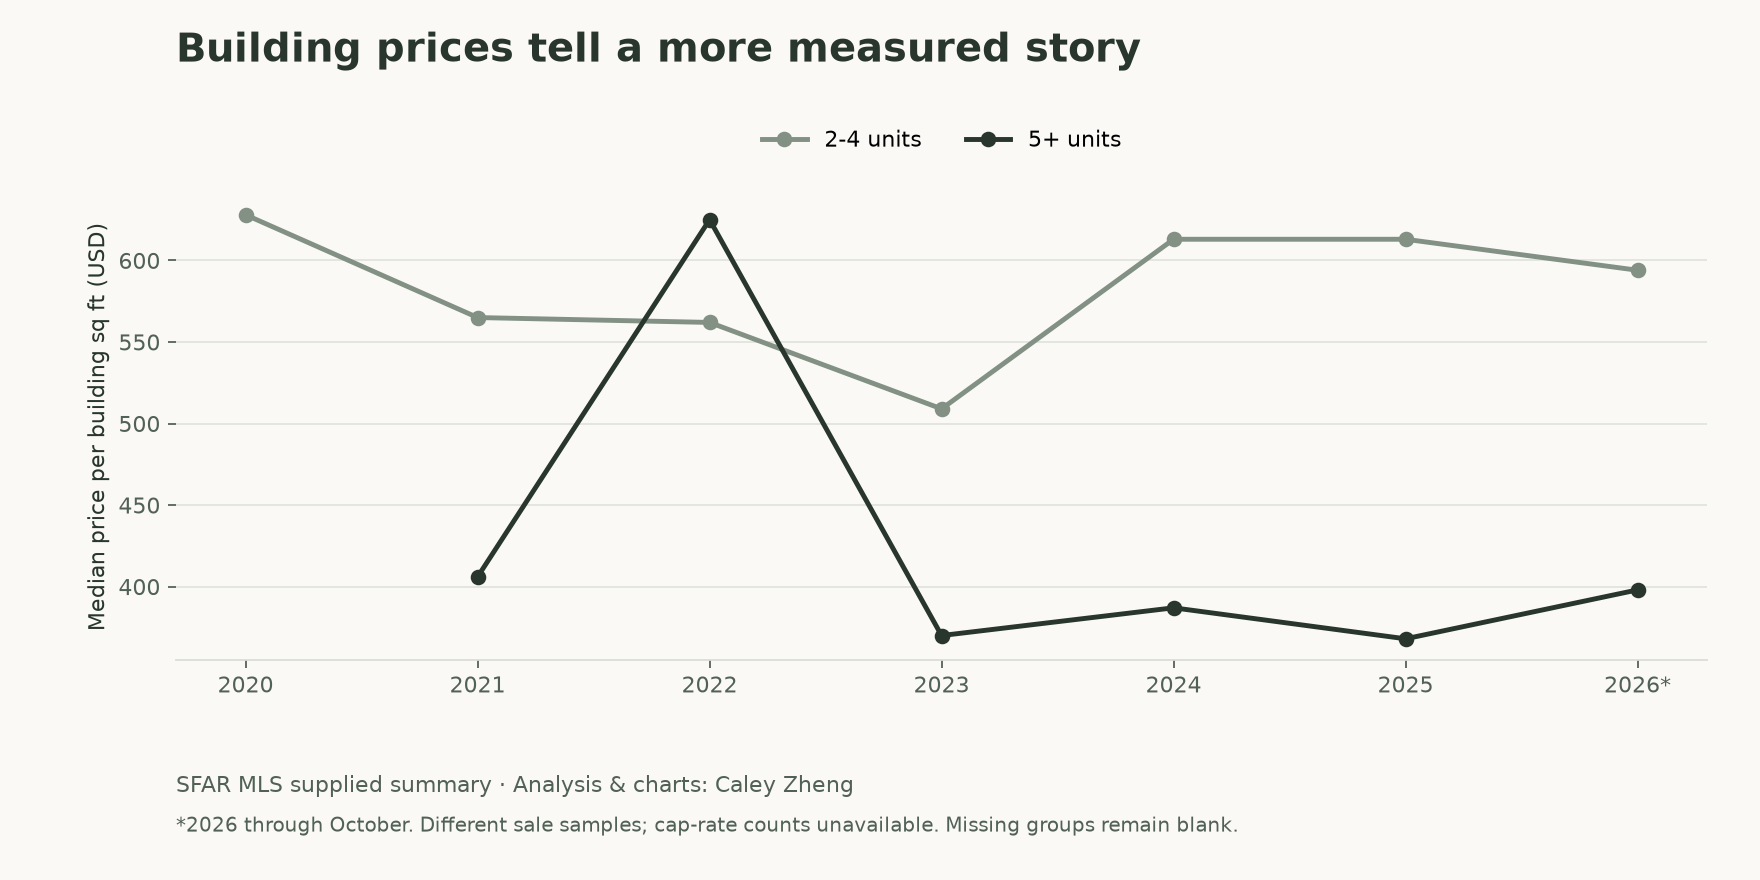
For five-plus-unit sales, median price per building square foot went from $406 in 2021 to $368 in 2025, a decline of about 9.4%. It recovered to $398 in 2026 YTD, approximately 2.0% below the 2021 figure.
Building prices tell a more measured story
View chart data and downloads
| Year | Building size | Closed sales | Median price per sq ft |
|---|---|---|---|
| 2020 | 2-4 units | 8 | $628 |
| 2021 | 2-4 units | 16 | $565 |
| 2021 | 5+ units | 4 | $406 |
| 2022 | 2-4 units | 8 | $562 |
| 2022 | 5+ units | 1 | $625 |
| 2023 | 2-4 units | 9 | $509 |
| 2023 | 5+ units | 7 | $370 |
| 2024 | 2-4 units | 2 | $613 |
| 2024 | 5+ units | 7 | $387 |
| 2025 | 2-4 units | 5 | $613 |
| 2025 | 5+ units | 4 | $368 |
| 2026 YTD | 2-4 units | 8 | $594 |
| 2026 YTD | 5+ units | 7 | $398 |
Price per unit tells another part of the story: $295,000 for larger buildings in 2021, $319,400 in 2025, and $340,000 in 2026 YTD. Those figures moved differently from price per square foot. Unit size and the mix of buildings can explain why the two measures disagree. Neither is a repeat-sales appreciation index.
Small buildings also deserve a careful read. Their median price per square foot ranged from $509 to $628 across the reported years. The 2023 dip was meaningful; the other annual figures sit between $562 and $628. The 2026 median price per unit of $699,500 is effectively back at 2021’s $700,000. I read that as resilience in the selected sales, not immunity to financing costs.
If you are considering living in one unit, the economics need a second lens: possession, the other units’ lawful income, carrying costs, and the value of the space you will actually use. San Francisco Real Estate Company’s duplex, triplex, and fourplex owner-occupant guide works through those questions. My TIC buying guide explains a different ownership structure that buyers sometimes compare with a whole building.
View all 13 annual building-size groups
| Year | Segment | Closed sales | Median price per unit | Median price per sq ft | Median cap rate | Median days on market | Median close vs. original list |
|---|---|---|---|---|---|---|---|
| 2020 | 2-4 units | 8 | $636,600 | $628 | 5.1% | 38 | 98.2% |
| 2021 | 2-4 units | 16 | $700,000 | $565 | 2.5% | 32 | 94.3% |
| 2021 | 5+ units | 4 | $295,000 | $406 | 5.2% | 223 | 82.6% |
| 2022 | 2-4 units | 8 | $574,000 | $562 | 4.3% | 36 | 94.4% |
| 2022 | 5+ units | 1 | $380,800 | $625 | 4.5% | 76 | 93.4% |
| 2023 | 2-4 units | 9 | $495,000 | $509 | 4.4% | 17 | 99.2% |
| 2023 | 5+ units | 7 | $275,000 | $370 | 5.7% | 57 | 95.2% |
| 2024 | 2-4 units | 2 | $660,000 | $613 | n/a | 18 | 111.1% |
| 2024 | 5+ units | 7 | $415,000 | $387 | 6.4% | 78 | 100.0% |
| 2025 | 2-4 units | 5 | $450,000 | $613 | 7.2% | 33 | 100.6% |
| 2025 | 5+ units | 4 | $319,400 | $368 | 7.4% | 42 | 100.2% |
| 2026 YTD | 2-4 units | 8 | $699,500 | $594 | 3.2% | 21 | 100.0% |
| 2026 YTD | 5+ units | 7 | $340,000 | $398 | 5.3% | 44 | 101.5% |
4. Put the recent sales on the map.
These four selected 2026 closings appear in the report’s building examples. They are not the full set of 15 sales recorded across both size groups for 2026 YTD. Select a numbered pin or an address to see its reported price, unit count, cap rate, and marketing time.
Interactive map loading. All four sales are listed below.
Selected SFAR sales · Approximate Census address locations · Not current listings. Download mapped sale data · Report a base-map issue
I use the map to organize the questions, not to turn a neighborhood into a single comp. Grove Street sits north of Fell, and several examples extend beyond a narrow Hayes Valley rectangle. That is why I describe this as Hayes Valley and adjacent blocks. For address-level research, start with San Francisco Planning’s Property Information Map. For block-level context, compare my Hayes Valley buyer’s guide with San Francisco Real Estate Company’s Hayes Valley neighborhood guide.
5. The individual buildings bring the averages into focus.
1649 Market Street is the reminder that rates are not the whole story. The supplied record shows 70 units closing for $16.8 million in September 2021, against an original $28.5 million ask, after 409 days on market. That is 58.9% of original list during a low-rate period. The record does not establish the seller’s motivation or its pandemic-era rent roll. It does establish that cheap money did not make every asking price work.
141–145 Gough and 550 Fell show the negotiation in the tightening cycle. Gough closed in February 2023 for $2.4 million, about 14.1% below its original ask, at a reported 6.0% cap. Fell closed that September for $3.965 million, about 5.6% below ask, at 6.5%. Both show 106 marketing days. I would investigate their leases, expenses, condition, and loan options before attributing either discount entirely to rates.
501 Hayes illustrates the difference between a sale result and a counterfactual. Its August 2024 closing was $9.7 million for 18 units, $1.3 million below the original $11 million ask, with a reported 7.2% cap. If that cap used comparable annual NOI, it implies $698,400 of income. Capitalizing that same hypothetical income at 5.0% would produce $13.968 million. That illustrates how sensitive value is to the assumed cap rate. It does not establish that rates cost the seller $4 million; the source does not establish the earlier value, comparable income, or cause.
436 Oak is the small-building counterpoint. Three units closed in May 2026 for $3.363 million against a $2.495 million ask, a 34.8% premium, with eight reported days on market. That is strong competition for that property. It does not tell me whether the buyer occupied a unit, paid cash, used residential financing, or calculated a cap rate. I would not invent their reasoning from the closing price.
41 Octavia and 48 Haight make the going-in income question unavoidable. Octavia’s 12 units closed in October for $4.95 million at a reported 4.5% cap; Haight’s 26 units closed in February for $8.7 million at 5.3%. A buyer might accept a lower initial yield for several reasons, including income potential, cash financing, or a longer investment horizon. The records do not tell us which. Before paying for “upside,” I want the leases, lawful rent history, costs, and a plan that does not require a particular tenant to leave.
San Francisco Planning’s rent-stabilization and eviction-protection overview explains why legal income and physical capacity are different questions. Building age alone is not an exemption analysis. A 1962 construction date, for example, does not establish that a building is outside rent regulation. Use the Rent Board and property-specific professional review for the actual tenancies.
Compare all 14 selected historical transactions
| Building | Closed | Units | Price | Per unit | Cap rate | Days on market | Original ask |
|---|---|---|---|---|---|---|---|
| 1649 Market St | Sep 2021 | 70 | $16,800,000 | $240,000 | 3.5% | 409 | $28,500,000 |
| 401-427 Haight St | Dec 2021 | 23 | $5,320,000 | $231,300 | 6.4% | 236 | $6,300,000 |
| 451 Hayes St | Apr 2022 | 4 | $3,900,000 | $975,000 | 5.5% | 13 | $2,988,000 |
| 700 Page St | May 2022 | 13 | $4,950,000 | $380,800 | 4.5% | 76 | $5,300,000 |
| 141-145 Gough St | Feb 2023 | 10 | $2,400,000 | $240,000 | 6.0% | 106 | $2,795,000 |
| 550 Fell St | Sep 2023 | 15 | $3,965,000 | $264,300 | 6.5% | 106 | $4,200,000 |
| 627 Hayes St | Mar 2024 | 5 | $2,075,000 | $415,000 | 9.3% | 157 | $2,495,000 |
| 501 Hayes St | Aug 2024 | 18 | $9,700,000 | $538,900 | 7.2% | 85 | $11,000,000 |
| 509-511 Buchanan St | Jul 2025 | 4 | $1,405,000 | $351,250 | 8.5% | 38 | $1,595,000 |
| 295 Buchanan St | Dec 2025 | 12 | $4,625,000 | $385,400 | 6.8% | 48 | $4,700,000 |
| 48 Haight St | Feb 2026 | 26 | $8,700,000 | $334,600 | 5.3% | 49 | $8,700,000 |
| 436 Oak St | May 2026 | 3 | $3,363,000 | $1,121,000 | 4.5% | 8 | $2,495,000 |
| 41 Octavia St | Oct 2026 | 12 | $4,950,000 | $412,500 | 4.5% | 50 | $5,150,000 |
| 765-769 Grove St | Oct 2026 | 5 | $2,304,000 | $460,800 | 5.5% | 25 | $2,150,000 |
Reported by the supplied SFAR summary; individual MLS records and closing documents were not available for a new audit. Download selected sales CSV.
6. What I would do with this information.
If I were selling a larger building, I would start with an honest income statement and relevant closed sales, then test the price against current financing. The 2025 large-building median was 7.4%, but that is not a universal target cap or a promise of a 30-to-50-day sale. There were four transactions in that group. I want a pricing range that reflects the actual leases, deferred work, location, and likely buyer.
If I were buying one, I would run the in-place income case before the improved-income case. A plan that works only after cheap refinancing or rapid turnover is carrying more risk than its opening spreadsheet suggests. I also want capital reserves and a realistic maturity strategy. My loan-sizing example shows how a half-point coupon change can reduce available debt even when property income is unchanged.
For two-to-four-unit buyers and sellers, I would compare both the housing value and the investment obligations. The cap rate is not irrelevant; it is simply not the only reason someone buys a home with another front door. If the plan involves separate interests rather than buying the entire property, read my complete TIC guide and San Francisco Real Estate Company’s TIC financing guide before assuming the same loan structure applies.
I will watch fresh closes, current lender terms, and the gap between asking prices and documented income. San Francisco Real Estate Company’s neighborhood market reports offer another useful lens, with their own property definitions and reporting windows. I would not merge them into this sample or treat a rate forecast as an investment plan.
The takeaway I keep coming back to: rates change the math; the building determines which math matters. A location can be excellent and the price still need work. A low cap can reflect a deliberate strategy or a very optimistic spreadsheet. I want to know which before offer day.
Have a Hayes Valley building in mind? Send me the address and let’s work through the comparables. You can also explore my featured transactions or browse the Insights library.
Sources and how to read this sample
Transaction data: SFAR MLS, supplied report dated November 4, 2026. Analysis and charts: Caley Zheng. The annual groups total 86 closed Residential Income sales from January 2020 through October 2026. The report covers Hayes Valley and nearby blocks; its examples extend outside the stated core rectangle. This is not an official neighborhood boundary or a comprehensive citywide sample.
The 2026 figures are year to date; earlier groups cover full calendar years. Annual transaction counts range from one to 16 per size group. No five-plus-unit group was supplied for 2020; it is left missing rather than shown as a measured zero. Cap-rate observation counts were not supplied and can be smaller than sale counts. Fields are listing reported and may use differing income or expense assumptions. No fixed error band is established.
Price per square foot uses the source’s reported building-area measure. Prices, areas, cap rates, and marketing days were not independently reconstructed from raw MLS records. Medians compare different properties; they do not measure appreciation of the same buildings. The source does not include actual loan rates, leverage, buyer motivation, tenancy-level income, or a causal study. Selected trades illustrate questions, not proof of the reason for a purchase.
Map: four selected 2026 transactions from the report. Address positions use the U.S. Census Geocoder, retrieved November 4, 2026; they are approximate street-address locations, not parcel outlines. Base map © OpenStreetMap contributors; map interface uses Leaflet. Pins do not indicate current listings or client representation.
Reconciliation notes
The annual tables support a 9.4% large-building price-per-square-foot decline from 2021 to 2025, not a one-third decline. The 2026 small-building price-per-unit median is $500 below 2021. Grove is a five-unit property and remains in the five-plus group. April 2022 was the month after the Fed’s first March hike. The annual sale table totals 86. Unsupported statements about buyers’ intentions, individual loan terms, seller purchase history, guaranteed selling times, and a precise December rate probability are not used. The report’s active-listing snapshot is omitted because no underlying active records were supplied.