Ask me how San Francisco’s multifamily market is doing, and my first question is: how many units are we talking about?
A duplex with a place to live and a second rent check is having a very different conversation from a nine-unit apartment building with a rent roll to defend. Put them in one spreadsheet, average everything together, and you can end up confidently describing a property that barely exists.
I separated six full months of SFAR closing data into building sizes, months, ZIP codes, and listing characteristics. My starting point: 301 multifamily sales totaling $840.3 million from May through October 2026. That is 6.7% more transactions and 20.4% more dollar volume than the same six months of 2025.
The bigger six-month totals are encouraging. The financing and property-level details deserve a closer look.
1. More money changed hands. Then the pace cooled.
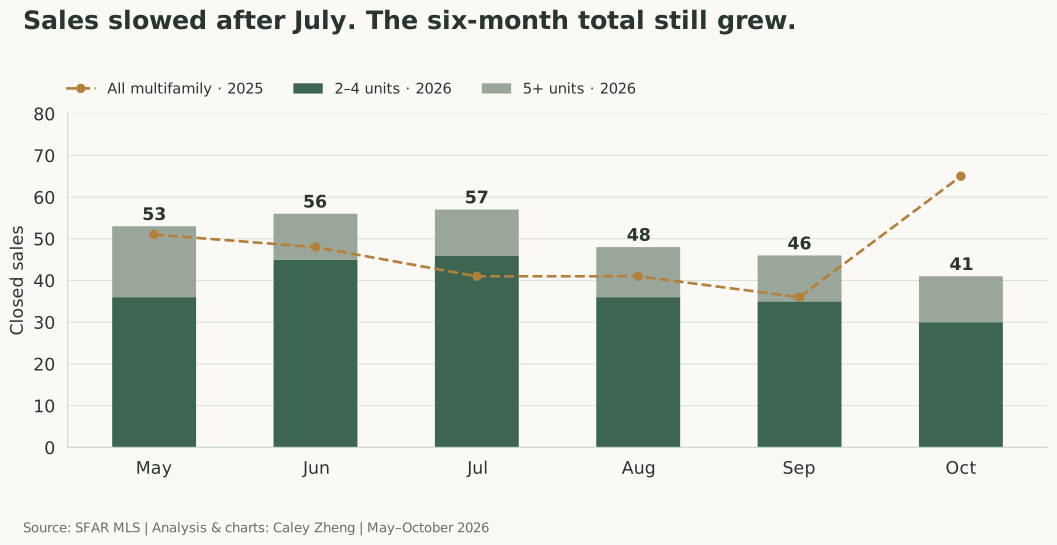
The six-month comparison looks healthy: 301 closings against 282 a year earlier, and $840.3 million against $697.7 million. Dollar volume grew roughly three times as quickly as transaction count. That tells me the mix and size of the trades matter; it does not tell me every building became 20% more valuable.
Zoom in on the monthly pattern and the mood changes. Closings peaked at 57 in July, then fell to 48 in August, 46 in September, and 41 in October. That is a 28.1% decline over three consecutive monthly drops.
A stronger six months, a slower finish
View chart data and downloads
| Month | Closings | 2 to 4 units | 5+ units | Volume ($M) | 2025 closings | 2025 volume ($M) |
|---|---|---|---|---|---|---|
| May 2026 | 53 | 36 | 17 | 149.1 | 51 | 109.4 |
| Jun 2026 | 56 | 45 | 11 | 150.4 | 48 | 143.2 |
| Jul 2026 | 57 | 46 | 11 | 144.8 | 41 | 98.5 |
| Aug 2026 | 48 | 36 | 12 | 128.4 | 41 | 88.6 |
| Sep 2026 | 46 | 35 | 11 | 139.3 | 36 | 90.6 |
| Oct 2026 | 41 | 30 | 11 | 128.3 | 65 | 167.4 |
The entire July-to-October decline came from two-to-four-unit buildings: 46 sales became 30. Five-plus-unit activity was 11 in July and 11 in October, with 12 in August. The commercial side was moving slowly, but it was moving steadily.
October’s year-over-year comparison is especially unforgiving: 41 sales versus 65 in October 2025, down 36.9%. I would read that alongside the full period’s growth rather than let one unusually busy comparison month write the whole headline.
There is also a useful contrast with other property types. October single-family closings were 96% of their May count; condos were 101%. Multifamily finished at 77%. Within this window, the fall recovery was less convincing for income buildings. I want the next month of closings before calling that a lasting shift.
2. The duplex market brought its own rulebook.
Of the 301 sales, 228 were two-to-four-unit buildings and 73 were five-plus-unit properties. Small buildings accounted for 75.7% of transactions. That is why a citywide multifamily statistic can sound more like the residential market than the apartment-investment market.
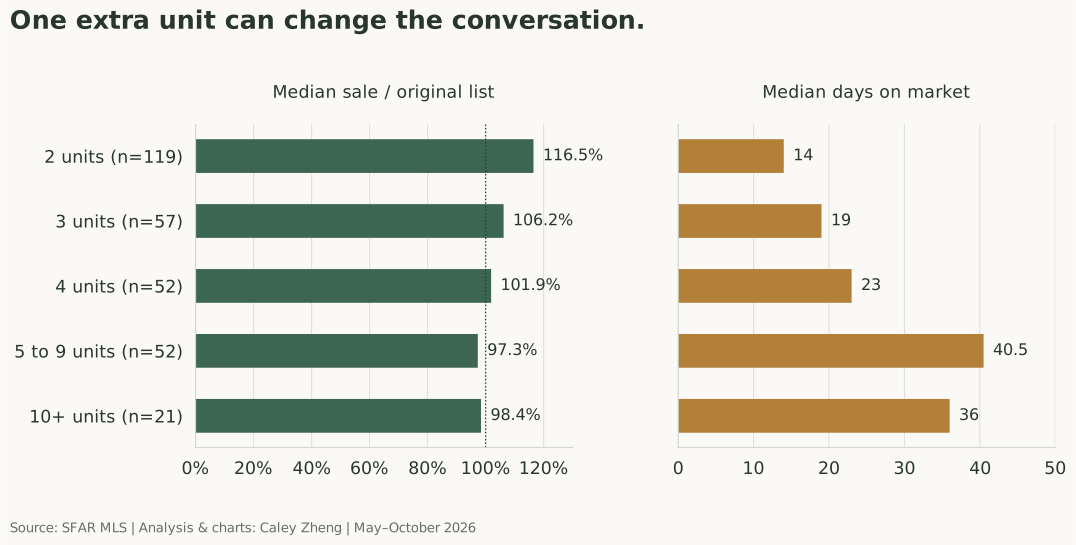
But even the “small building” label hides a lot. The six-month median duplex sold for 116.5% of its original asking price in 14 days. Triplexes landed at 106.2% in 19 days. Fourplexes were much closer to asking: 101.9% in 23 days.
Building size changes price competition and timing
View chart data and downloads
| Units | Closings | Median $/unit | Sale to orig list | Median DOM | Median cap rate (n reporting) |
|---|---|---|---|---|---|
| 2 | 119 | $1,150,000 | 116.5% | 14 | 3.62% (39) |
| 3 | 57 | $666,667 | 106.2% | 19 | 4.81% (39) |
| 4 | 52 | $473,125 | 101.9% | 23 | 5.24% (39) |
| 5 to 9 | 52 | $395,850 | 97.3% | 40.5 | 5.52% (47) |
| 10+ | 21 | $354,167 | 98.4% | 36 | 5.16% (20) |
At five to nine units, the median was 97.3% of original list and 40.5 days on market. Ten-plus-unit properties came in at 98.4% and 36 days. My takeaway is practical: I would prepare a duplex buyer for a different process from a buyer pursuing a six-unit building. The unit count is doing real work here.
The pricing gap is just as striking. Median price per unit was $1.15 million for duplexes, $666,667 for triplexes, $473,125 for fourplexes, $395,850 for five-to-nine-unit buildings, and $354,167 for ten-plus. A “unit” is a counting device, not a standardized product. Size, condition, occupancy, location, and the possibility of living there all affect what that unit is worth.
My interpretation is that owner-use flexibility helps explain the premium on smaller buildings. The closing tables do not identify every buyer’s motivation, so I am treating that as an explanation to test, not a measured share of owner-occupant purchases.
3. Prices firmed while fewer buildings sold.
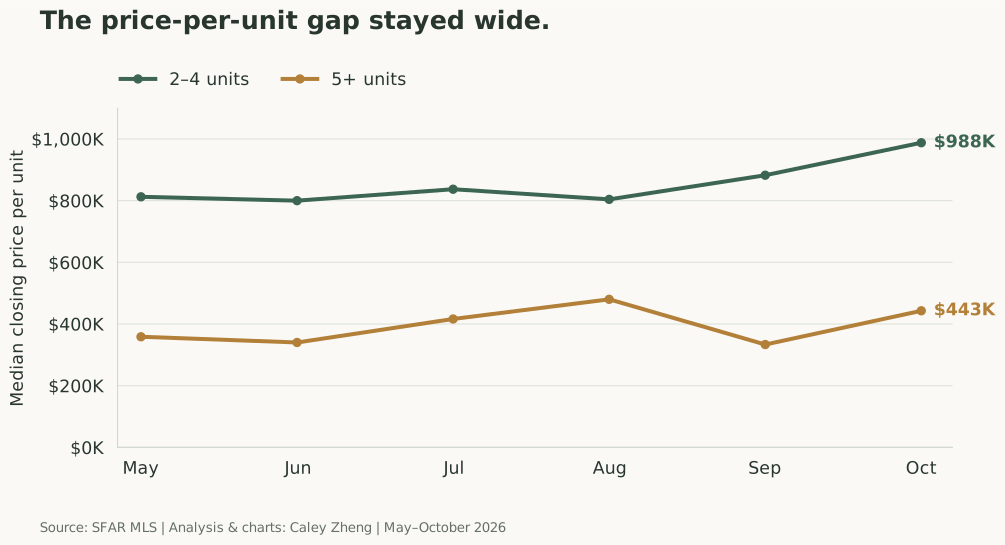
Inside the two-to-four-unit segment, monthly median price per unit rose from $812,500 in May to $987,917 in October, a 21.6% increase between those two monthly samples. Larger buildings ranged from $333,333 to $480,000 per unit, finishing October at $442,857.
Price per unit: two distinct markets
View chart data and downloads
| Month | 2 to 4: $/unit | 5+: $/unit |
|---|---|---|
| May 2026 | $812,500 | $358,529 |
| Jun 2026 | $800,000 | $340,000 |
| Jul 2026 | $837,083 | $416,250 |
| Aug 2026 | $804,167 | $480,000 |
| Sep 2026 | $882,500 | $333,333 |
| Oct 2026 | $987,917 | $442,857 |
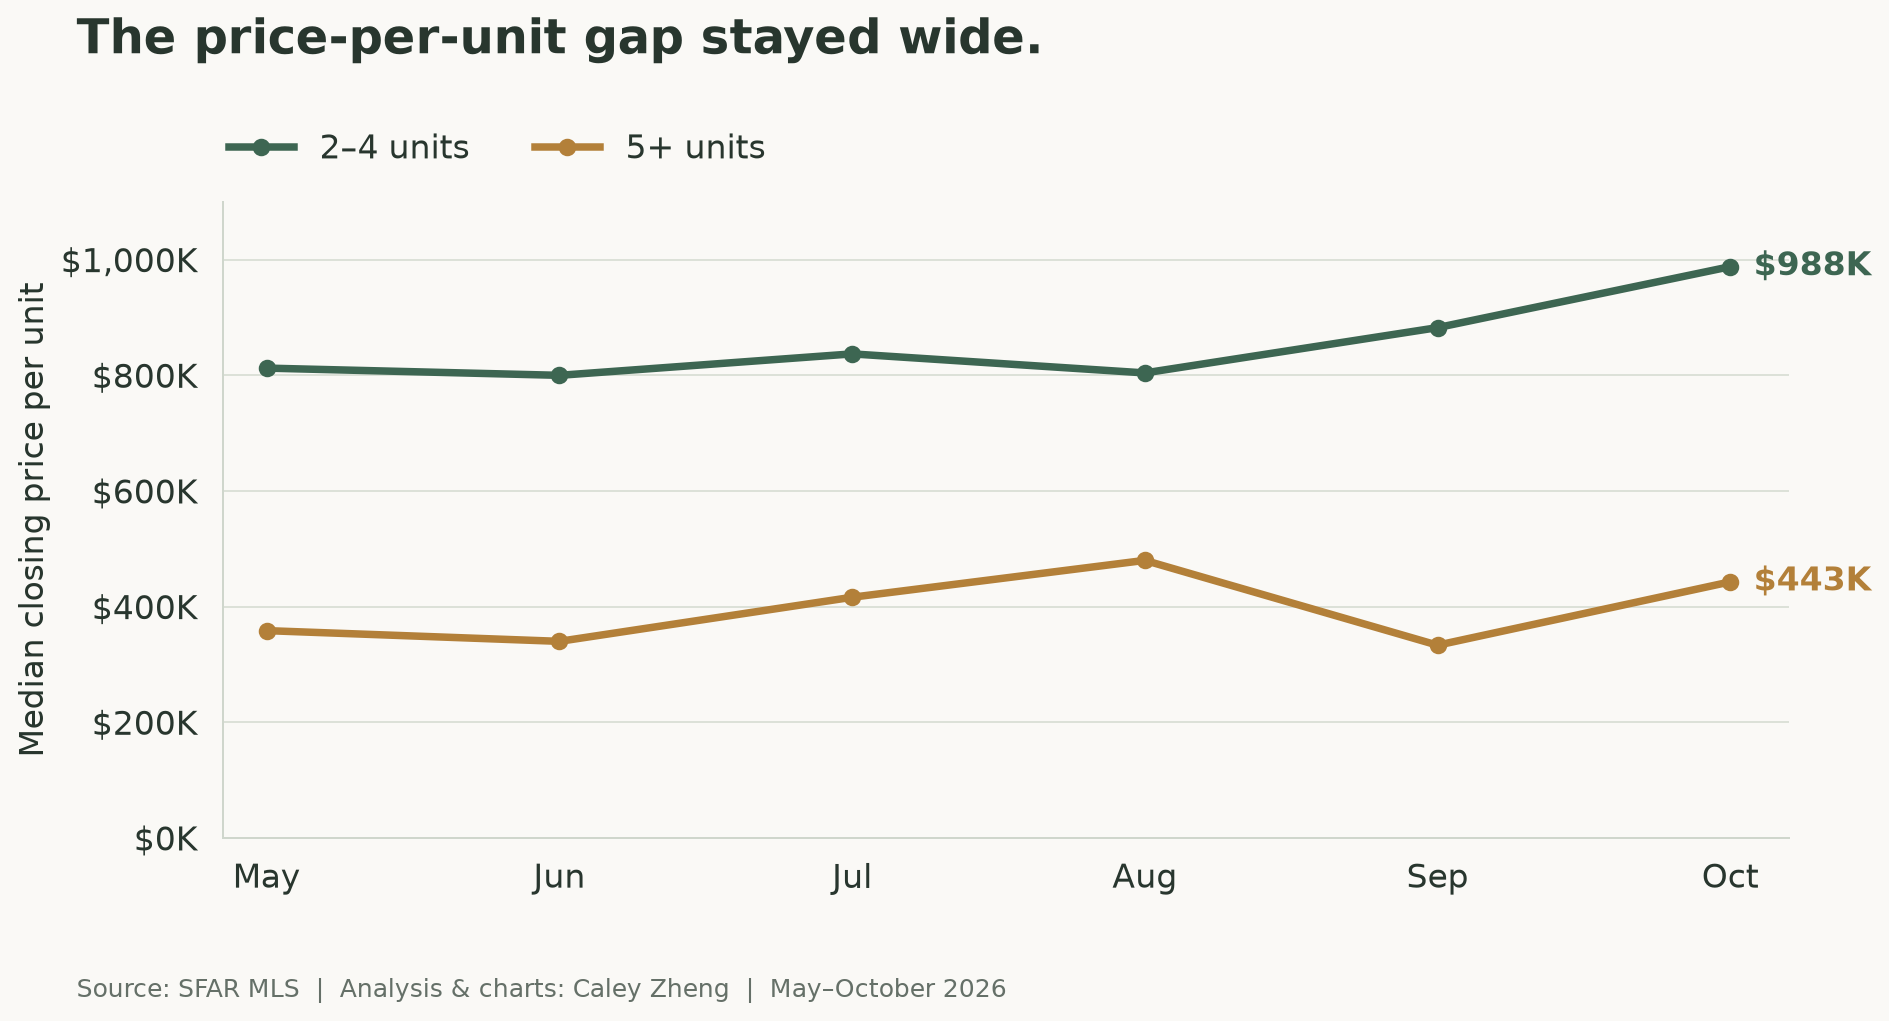
That is a wide and persistent gap. It is also where I put a firm hand on the spreadsheet: a change in the median is not the appreciation rate of the same property. Different buildings sold each month. Even within the small-building segment, a different mix of duplexes, occupancy, renovations, and neighborhoods can move the number.
The all-multifamily median closing price rose from $2.122 million in May to $2.95 million in October. Yet the highest all-market median price per unit was August’s $717,833, not October’s $700,000. Those two metrics answer different questions. I care about both, and I do not want a dramatic October building-price headline to erase the distinction.
Two larger recorded trades show why the income side still needs property-level analysis. An 18-unit building at 2490 Greenwich Street closed for $9.995 million, 97.5% of original list, after 23 days. A 32-unit building at 101 Point Lobos Avenue closed for $9.9 million, 86.1% of original list, after 100 days. Their reported cap rates were 4.65% and 5.25%, respectively. Same broad asset class; very different negotiations.
The size-band cap-rate medians were 5.52% for five-to-nine-unit buildings and 5.16% for ten-plus. These are agent-reported figures from 47 and 20 observations, respectively. I use them as context while checking the actual income and expenses. They are not a promise of cash flow after financing.
4. For larger buildings, the loan can set the price.
The interest-rate story adds an important piece to this market. A buyer can like the building, believe in the neighborhood, and still need more cash to make the financing work. On an apartment purchase, the lender gets a vote.
What actually changed during these six months
The Federal Reserve raised its policy target by a quarter point in September, to 3.75%–4.00%, and held that range in October. But the Fed’s overnight rate is only one piece of a commercial mortgage.
For fixed-rate financing, I also watch Treasury yields and the lender’s spread. Freddie Mac’s Index Lock terms explicitly separate the Treasury index from the spread. Its floating-rate product uses 30-day average SOFR. A fixed loan and a floating loan can therefore respond differently to the same Fed announcement.
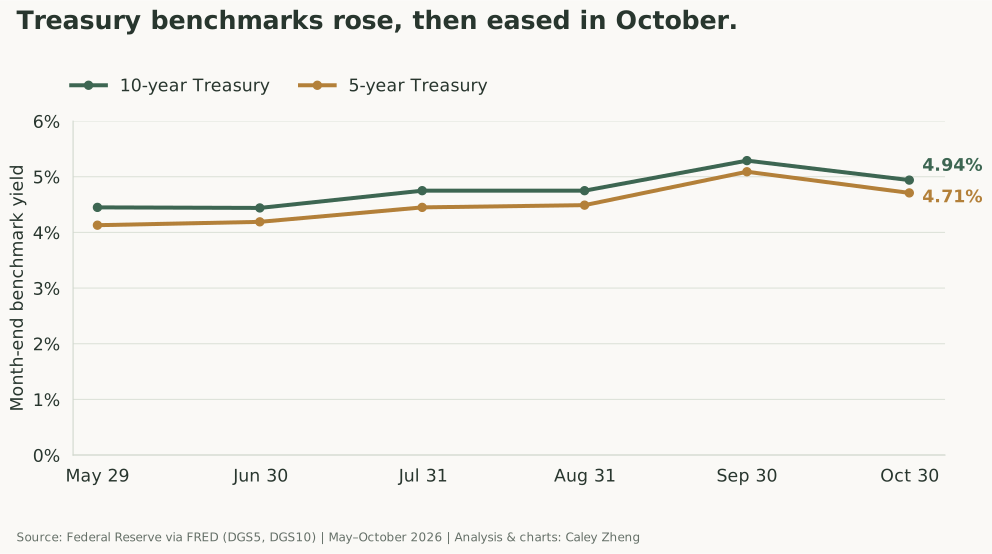
The financing backdrop changed during the sales period
View chart data and downloads
| Observation date | 5-year Treasury (%) | 10-year Treasury (%) |
|---|---|---|
| 2026-05-29 | 4.13 | 4.45 |
| 2026-06-30 | 4.19 | 4.44 |
| 2026-07-31 | 4.45 | 4.75 |
| 2026-08-31 | 4.49 | 4.75 |
| 2026-09-30 | 5.09 | 5.29 |
| 2026-10-30 | 4.71 | 4.94 |
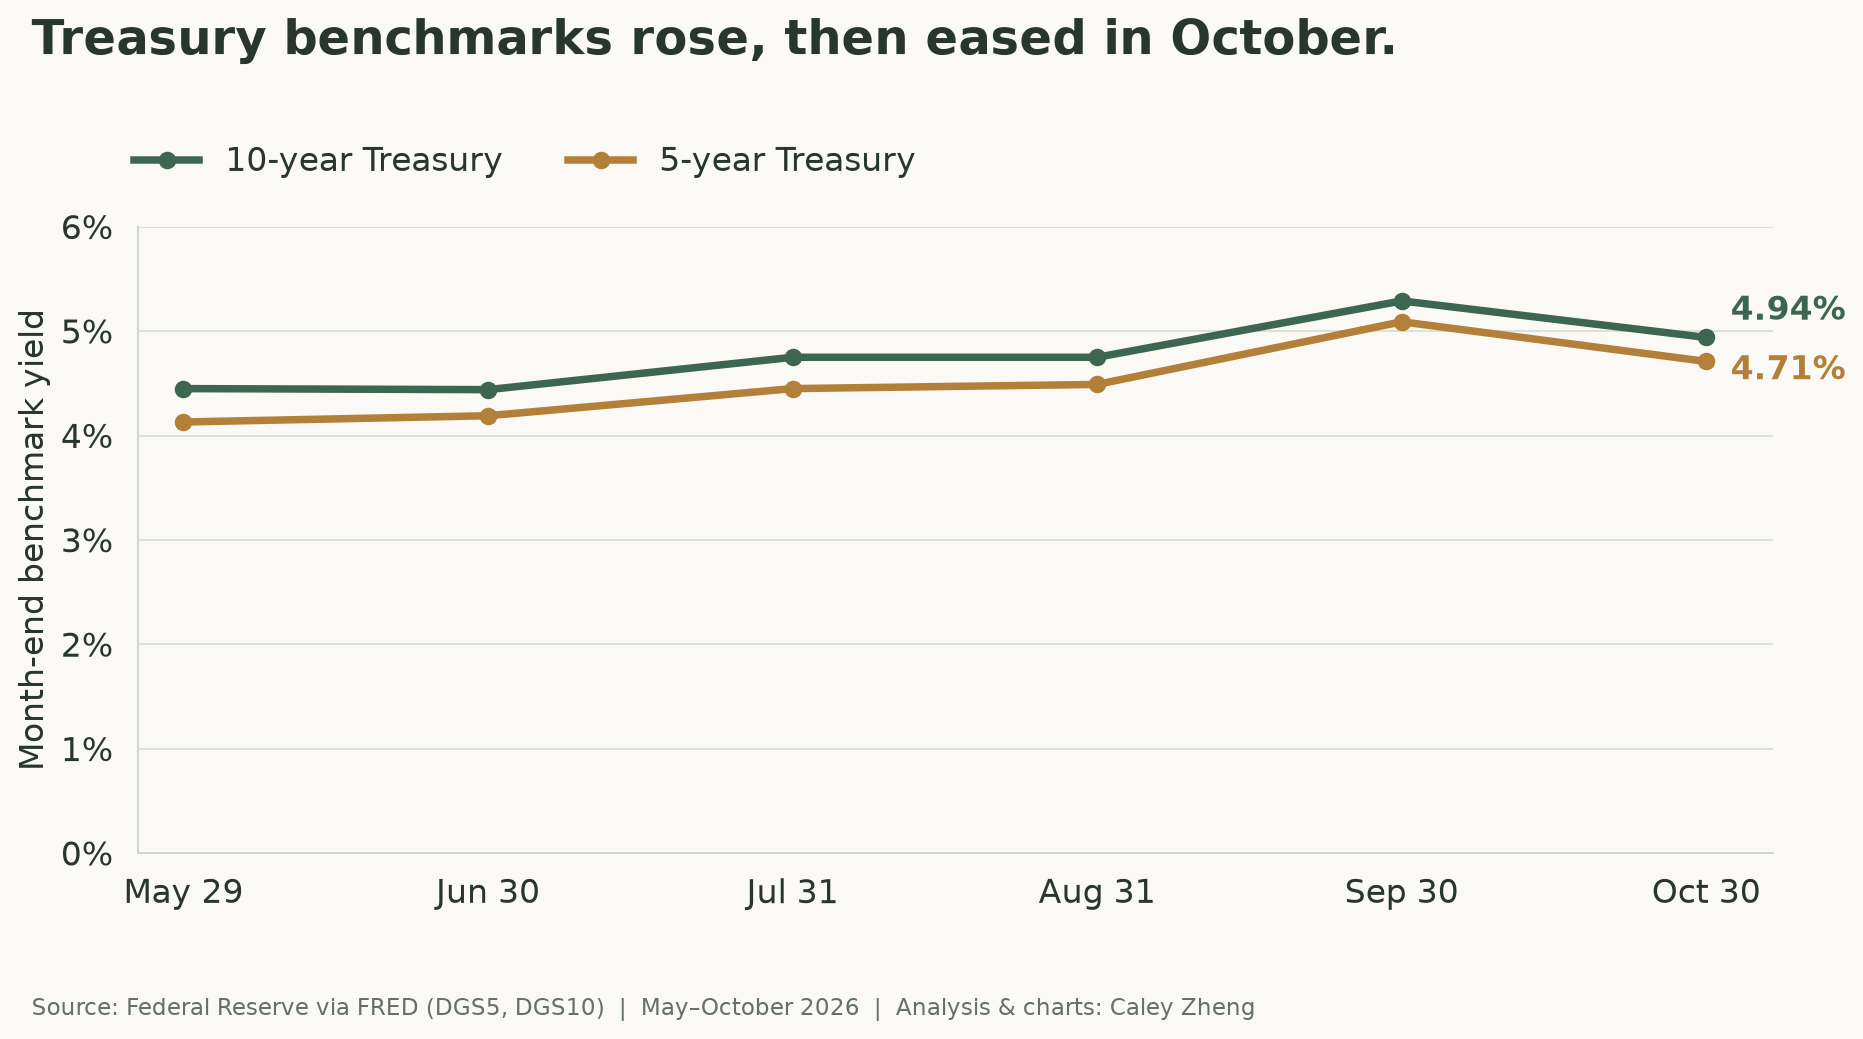
At the last available trading day of May, the 10-year Treasury was 4.45%. It reached 5.29% at September’s end and finished October at 4.94%: up 0.49 percentage point from May, even after October’s retreat. The five-year rose from 4.13% to 4.71% over the same endpoints. These are Federal Reserve benchmark yields, not the actual mortgage rates paid on the SFAR transactions. Loan spreads, rate locks, structure, and borrower quality still matter.
National lending activity supports taking that pressure seriously. In its October 29 results discussion, Freddie Mac reported third-quarter multifamily new business of $16 billion versus $25 billion a year earlier and attributed the decline primarily to elevated mortgage rates. That includes its own financing activity, rather than all U.S. apartment purchases, but it is a useful piece of context for the local closing data.
How a higher rate turns into a smaller loan
For an income building, I start with the cash flow available to cover the debt. Debt-service coverage ratio, or DSCR, measures that cash flow against required debt payments. A 1.25x ratio means $1.25 available for each $1 of debt service. Fannie Mae’s conventional multifamily term sheet lists a 1.25x minimum and an 80% maximum loan-to-value ratio for eligible stabilized properties with at least five units. Actual underwriting can require less leverage.
Here is my simplified illustration: a $3 million building producing $159,000 a year of net operating income, equivalent to a 5.3% cap rate. I hold the price and income constant, assume lender-underwritten cash flow equals that income, use monthly payments on a 30-year amortization schedule, and require 1.25x coverage. The rates below are hypothetical sensitivity cases, not lender quotes or a reconstruction of anyone’s loan.
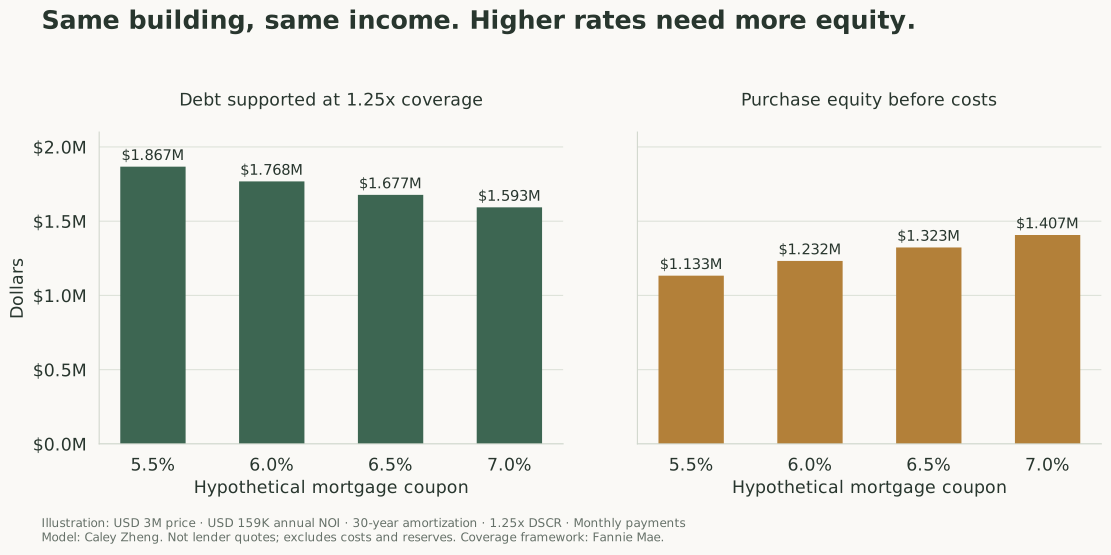
The same income supports less debt at a higher rate
View chart data and downloads
| Hypothetical loan coupon | Annual debt service at 65% LTV | DSCR at 65% LTV | Maximum loan at 1.25x DSCR | Purchase equity before costs | Debt-supported LTV |
|---|---|---|---|---|---|
| 5.50% | $132,863 | 1.197x | $1,866,891 | $1,133,109 | 62.23% |
| 6.00% | $140,295 | 1.133x | $1,767,991 | $1,232,009 | 58.93% |
| 6.50% | $147,904 | 1.075x | $1,677,035 | $1,322,965 | 55.90% |
| 7.00% | $155,681 | 1.021x | $1,593,260 | $1,406,740 | 53.11% |
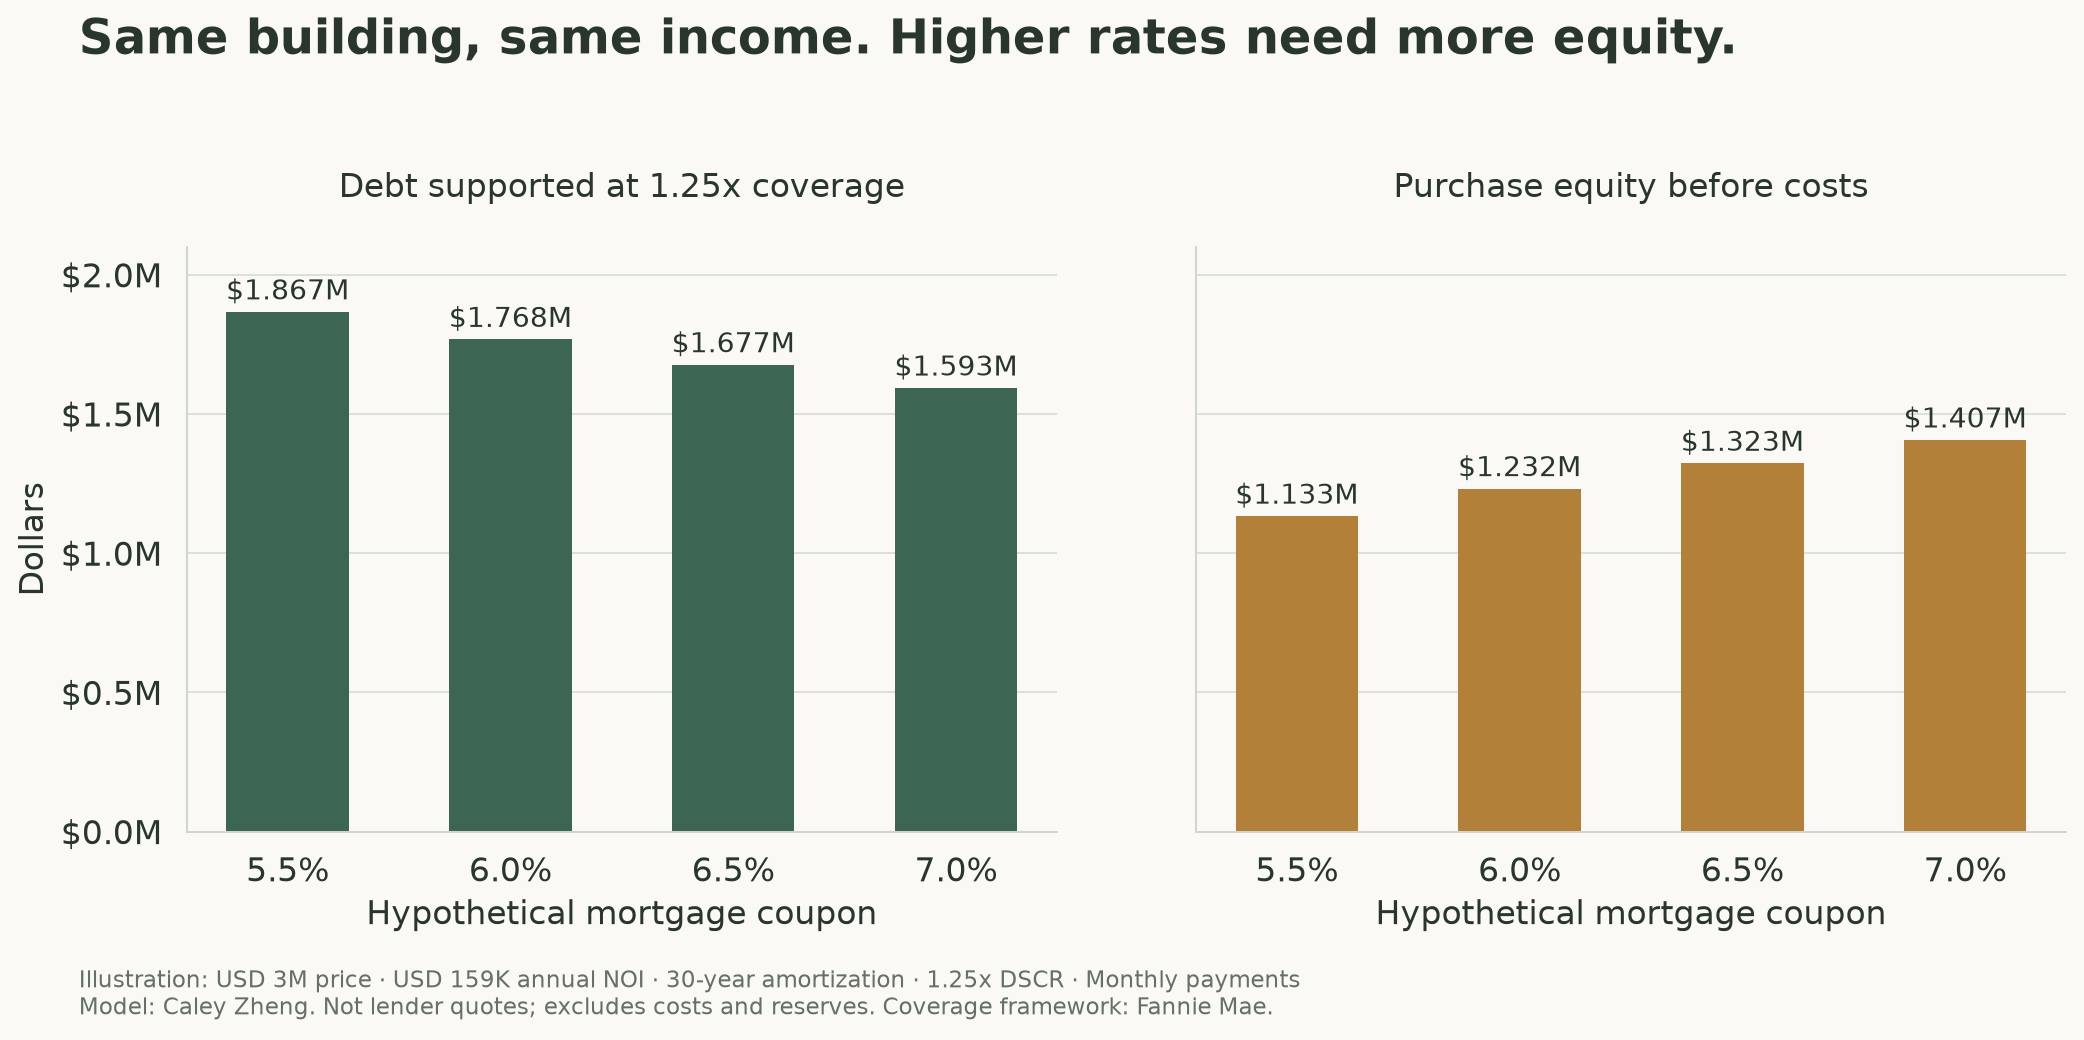
At a 6.0% coupon, that income supports about $1.768 million of debt. At 6.5%, it supports about $1.677 million. The extra half point requires roughly $91,000 more purchase equity if the price and income stay the same. Closing costs and reserves would add to the cash needed.
Even a proposed 65% loan does not automatically fit: at 6.5%, its roughly $147,904 annual payment leaves only 1.075x coverage on $159,000 of income. To reach 1.25x, the illustrated loan falls to about 55.9% of the purchase price. An advertised maximum LTV is a ceiling; cash-flow coverage can become the tighter constraint.
This helps explain why I pay so much attention to the rent roll and verified expenses on larger buildings. With the same income, a buyer needs more equity, a lower price, different financing, or an acceptable path to stronger operations. If borrowing costs exceed the property’s income yield, leverage also puts pressure on current cash returns. Principal amortization makes the cash-payment burden larger than the interest rate alone suggests.
Existing owners face a different clock
An owner with a fixed-rate loan does not suddenly pay a new coupon every time the Fed meets. The financing reset may come at maturity. Freddie Mac’s 2025 annual report describes multifamily loans commonly amortizing over 30 years but maturing in five to ten, often leaving a balloon balance to refinance. A higher replacement rate can require a principal paydown or additional equity. That can influence whether an owner sells, holds, or recapitalizes; it does not establish that a particular discounted sale was distressed.
My conclusion is that financing pressure strengthens the explanation for deliberate, income-focused apartment negotiations. It does not prove that rates caused the overall July-to-October volume decline. That decline began before September’s Fed hike and came from two-to-four-unit sales; five-plus-unit closings held near 11–12 a month after June. The SFAR summaries do not include actual loan coupons, leverage, cash purchases, rate-lock dates, or contract dates. I cannot measure a causal interest-rate effect from them.
Small-building buyers feel higher rates too. The difference is that some are also buying their own housing and flexibility. For the apartment investor, the building’s income has to carry more of the argument—and increasingly, more of the financing calculation.
5. In a small building, the keys are part of the product.
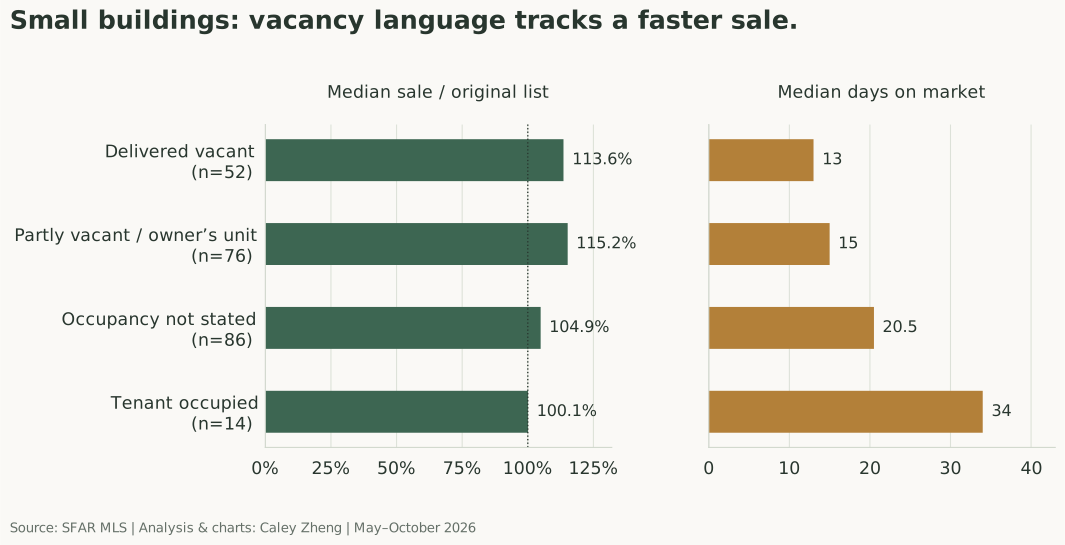
The occupancy cut is one of the most interesting parts of this dataset. Among two-to-four-unit buildings, listings described as delivered vacant closed at a median 113.6% of original list in 13 days. Those mentioning partial vacancy or an owner’s unit reached 115.2% in 15 days. The 14 listings described as tenant occupied were at 100.1% in 34 days.
What the listing says about occupancy matters
View chart data and downloads
| Segment | Occupancy per listing remarks | Closings | Median $/unit | Sale to orig list | Median DOM |
|---|---|---|---|---|---|
| 2 to 4 | Delivered vacant | 52 | $725,000 | 113.6% | 13 |
| 2 to 4 | Partly vacant or owner's unit | 76 | $932,500 | 115.2% | 15 |
| 2 to 4 | Not stated | 86 | $816,667 | 104.9% | 20.5 |
| 2 to 4 | Tenant occupied | 14 | $625,000 | 100.1% | 34 |
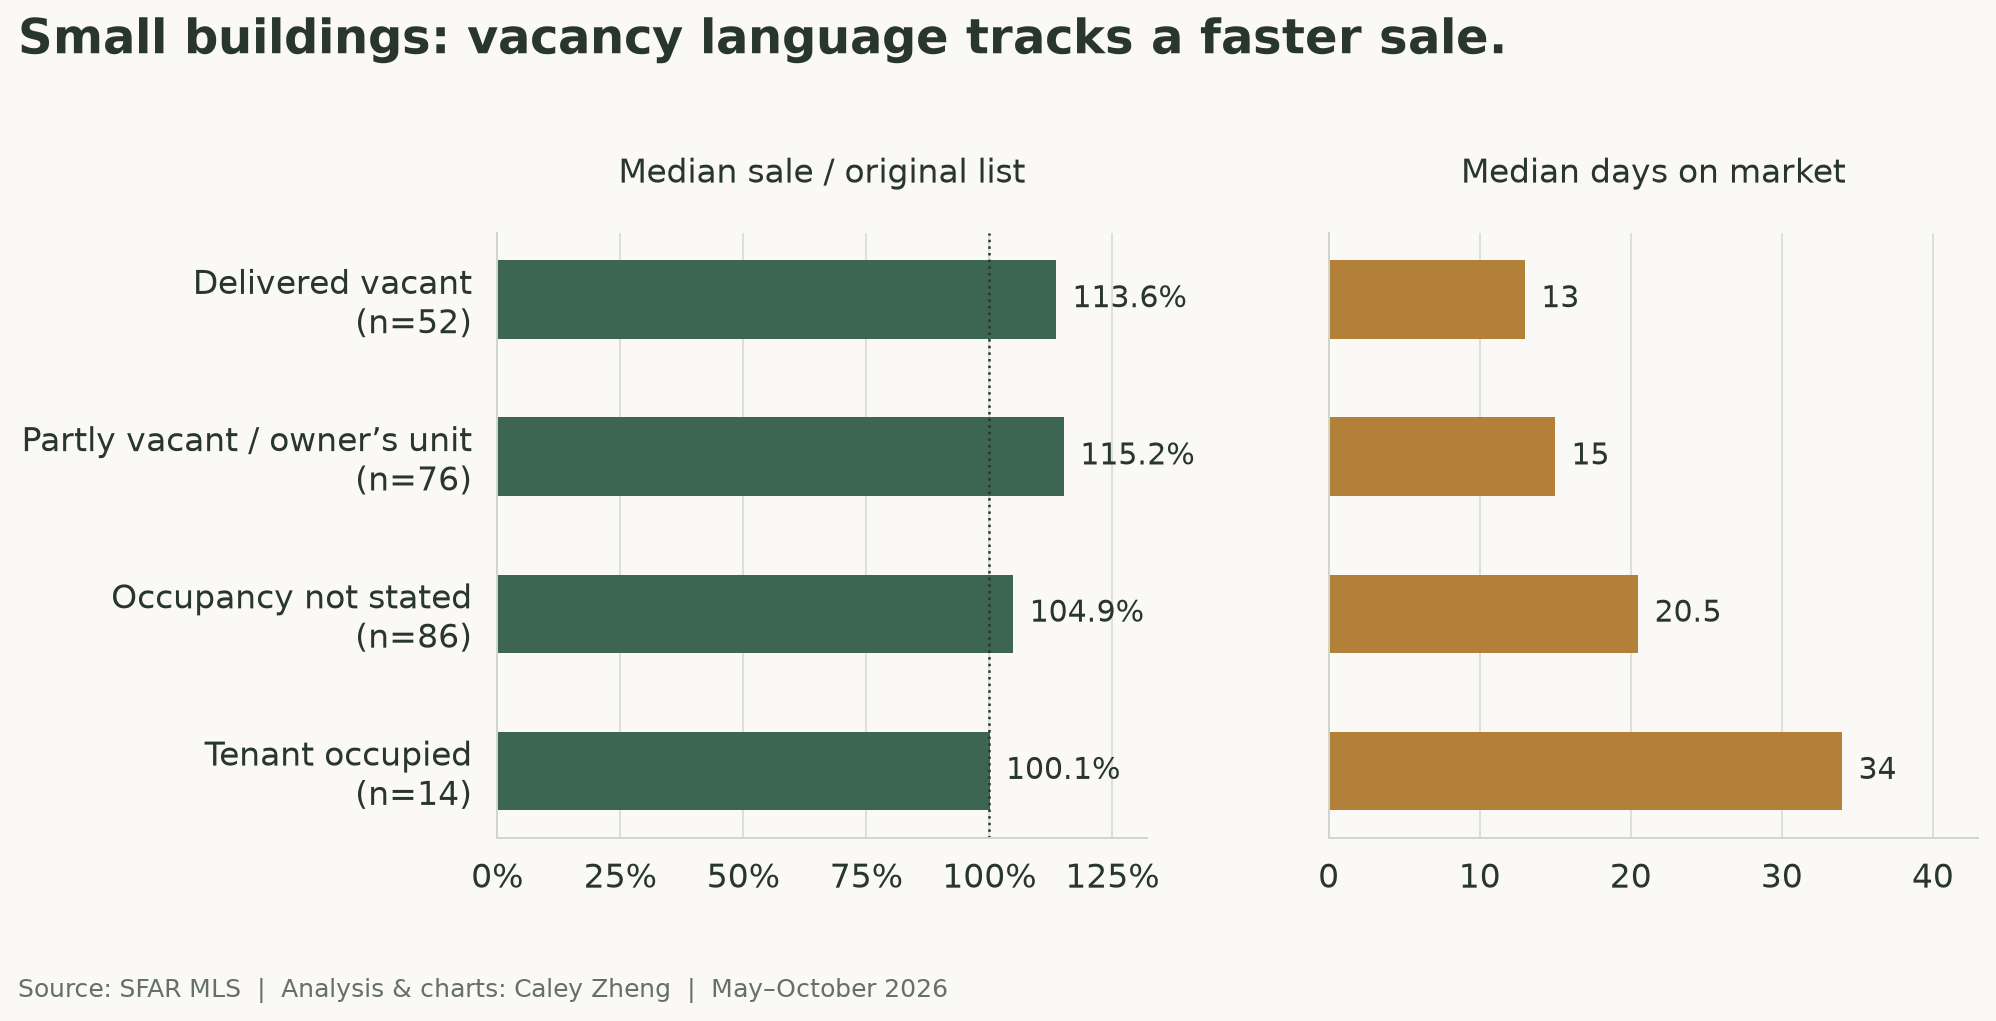
I see a market placing value on immediate options: living in a unit, choosing how to use the space, and understanding what is actually available at closing. The second unit may produce income, but possession of the first one can be the emotional engine.
The measurement deserves some humility. Occupancy was classified from words in listing remarks, not a verified unit-by-unit tenancy review. “Not stated” covers 86 small-building sales, and the tenant-occupied group has only 14. These groups also differ in ways the summary cannot control for. The numbers show an association; they do not isolate a vacancy premium for an otherwise identical building.
For me, the useful question is specific: what exactly is being delivered, and how does that change the buyer pool? “Multifamily” on a listing sheet is the beginning of that conversation.
6. Location changes the price tag and the pace.
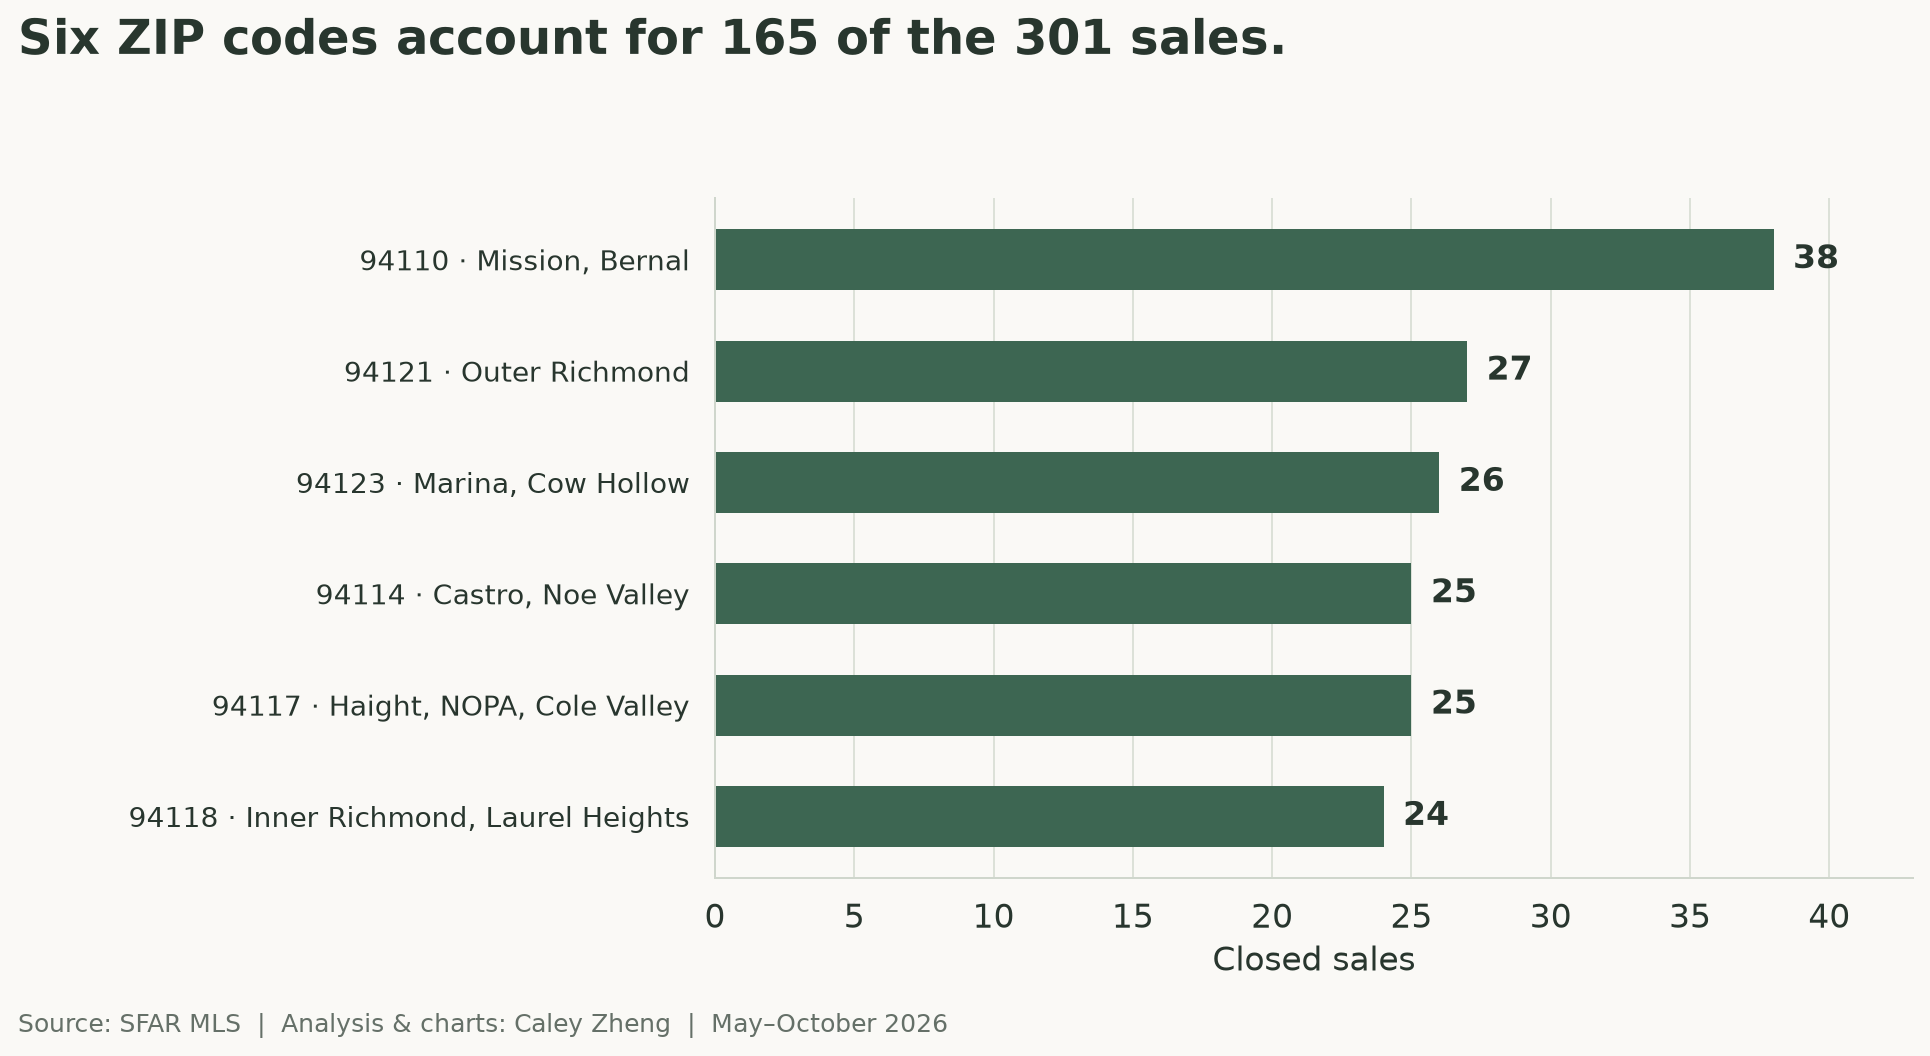
Six ZIP codes generated 165 of the 301 closings, or 54.8%. The Mission/Bernal ZIP, 94110, led with 38 sales. The two Richmond ZIPs contributed 51 combined. Marina/Cow Hollow, Castro/Noe Valley, and Haight/NOPA/Cole Valley rounded out the top six.
Where the transactions happened
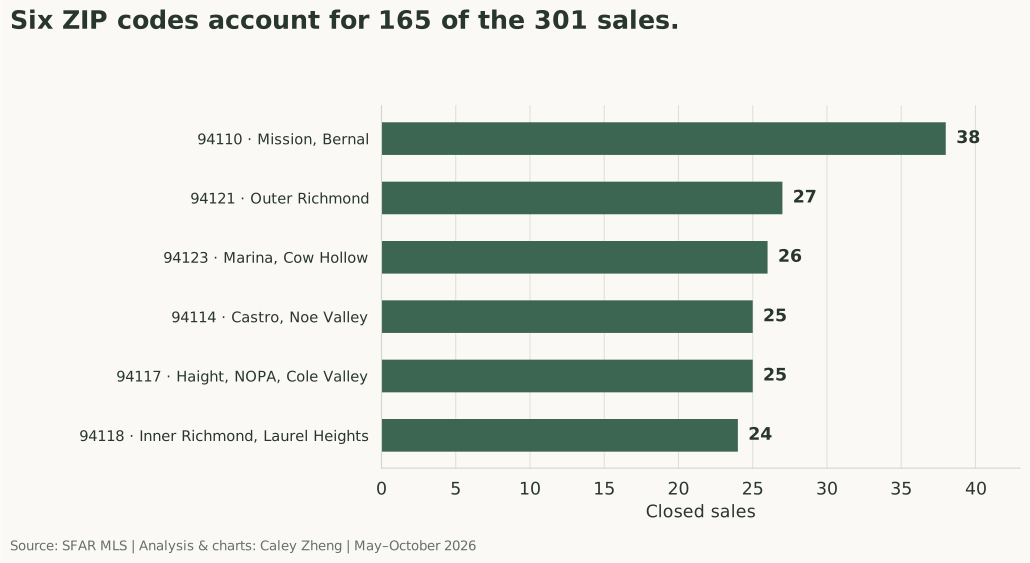
View chart data and downloads
| ZIP | Area | Closings | Median $/unit |
|---|---|---|---|
| 94110 | Mission, Bernal | 38 | $528,800 |
| 94121 | Outer Richmond | 27 | $667,250 |
| 94123 | Marina, Cow Hollow | 26 | $1,003,333 |
| 94114 | Castro, Noe Valley | 25 | $666,667 |
| 94117 | Haight, NOPA, Cole Valley | 25 | $733,333 |
| 94118 | Inner Richmond, Laurel Heights | 24 | $787,917 |
Among ZIP codes with at least six sales in the geographic table, 94123 had the highest median price per unit at about $1.003 million. It also had a 13-day median marketing period. The 94110 median was $528,800 per unit and 20.5 days. That is a substantial difference before we even open a floor plan.
Then there is 94109: 20 sales, an average of ten units per building, a 42-day median marketing period, and 97.3% of original list. Comparing that directly with a duplex-heavy area would tell me as much about building mix as neighborhood demand.
I use ZIPs to organize the search, then tighten the comparison. They are not precise neighborhood boundaries. 94102, for example, includes both Hayes Valley and the Tenderloin. A ZIP-code median cannot tell me what a particular block, tenancy, or renovation is worth.
7. The condo spread gets my attention. Then I ask harder questions.
The median condo price per square foot was about 2.57 times the multifamily figure in 94133, 2.20 times in 94109, 2.10 times in 94118, and 2.04 times in 94121. In 94131, the ratio narrowed to 1.10.
A price gap with different denominators
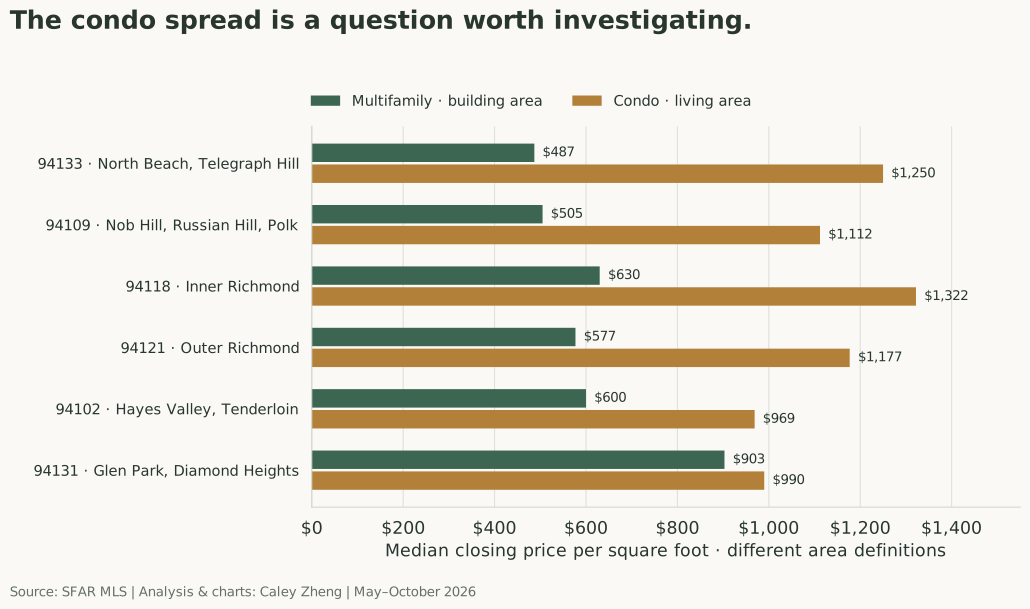
View chart data and downloads
| ZIP | Area | Multi-family closings | Multi-family $/sq ft | Condo closings | Condo $/sq ft | Condo to MF ratio |
|---|---|---|---|---|---|---|
| 94133 | North Beach, Telegraph Hill | 20 | $487 | 31 | $1,250 | 2.57x |
| 94109 | Nob Hill, Russian Hill, Polk | 20 | $505 | 149 | $1,112 | 2.20x |
| 94118 | Inner Richmond | 24 | $630 | 46 | $1,322 | 2.10x |
| 94121 | Outer Richmond | 27 | $577 | 19 | $1,177 | 2.04x |
| 94102 | Hayes Valley, Tenderloin | 10 | $600 | 57 | $969 | 1.62x |
| 94131 | Glen Park, Diamond Heights | 14 | $903 | 38 | $990 | 1.10x |
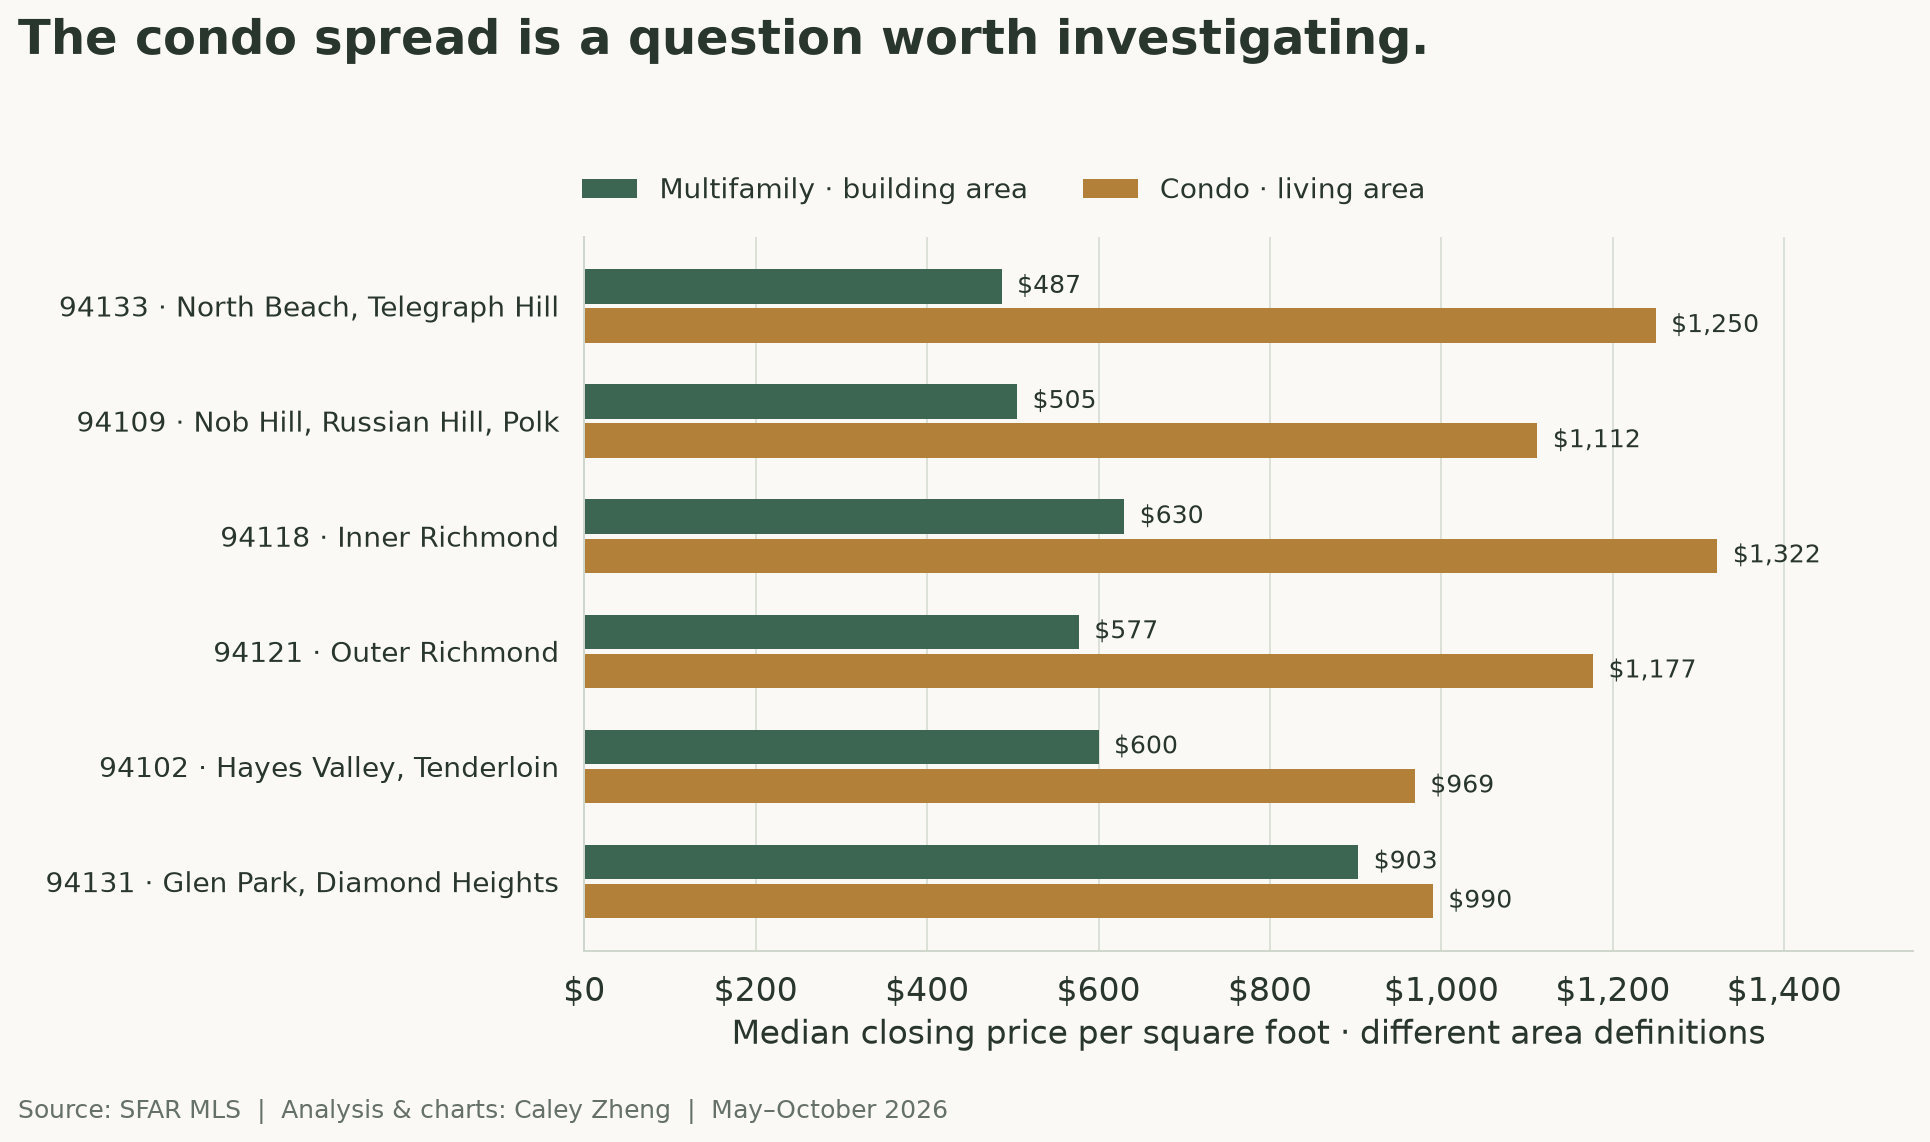
Those gaps are worth investigating. They can help explain why buyers see a different opportunity in a smaller building with flexible use than in a stabilized apartment investment.
But the denominators do not match. Multifamily uses total building area; condos use living area. Hallways, garages, and unfinished space can make the building number look cheaper. The properties also differ in condition, amenities, unit size, and construction era. Subtracting one median from the other does not produce a renovation budget or a profit forecast.
My next step is to reconcile usable area, condition, occupancy, financing, carrying costs, and the actual ownership strategy. A potential conversion also needs its own eligibility and approval review; San Francisco Public Works maintains the current condominium-conversion application pathways. The spread is a starting point for questions. The city does not issue permits because my spreadsheet has a nice green cell.
8. Asking price is a strategy. It is not the valuation.
San Francisco can make an asking price feel like the opening bid at an auction. Take the recorded sale at 1012–1014 Clayton Street: $1.58 million against an original $795,000 ask, or 198.7% of list. That is eye-catching. It does not mean the property doubled in value in six days.
The broader pricing buckets are more useful. Small buildings listed at least 20% below their ZIP’s median price per square foot sold at a median 106.9% of ask. Those listed within 5% of the ZIP median sold at 112.6%. Aggressive underpricing did not, by itself, deliver the strongest ratio. Asset differences are tangled up in those buckets, so I would not turn either number into a guaranteed pricing formula.
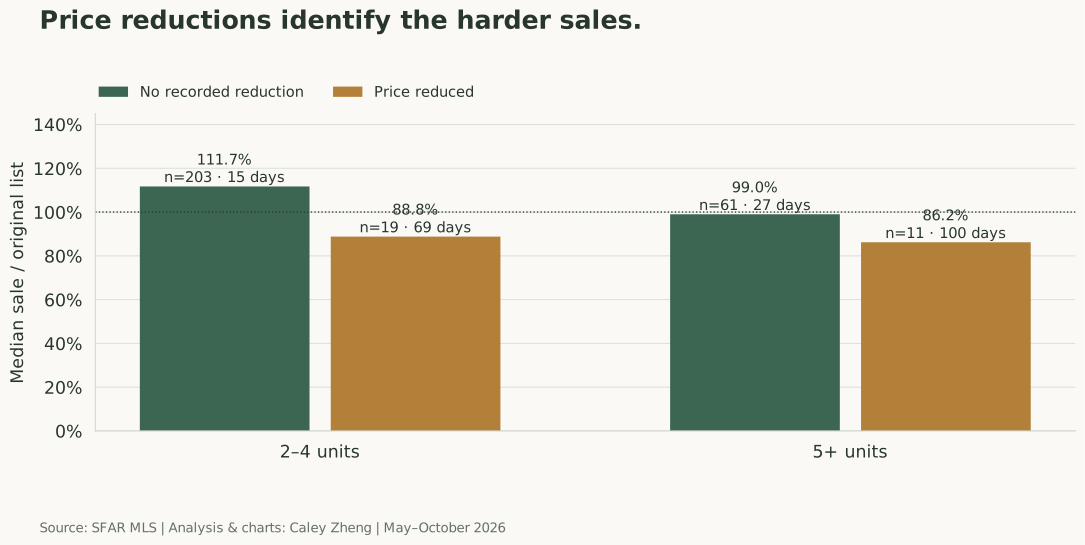
The price-cut analysis points to another distinction: the easier sales and the difficult ones.
The difficult sales took longer
View chart data and downloads
| Segment | Price reduced before sale | Closings | Sale to original list | Sale to final list | Median DOM |
|---|---|---|---|---|---|
| 2 to 4 | No | 203 | 111.7% | 111.0% | 15 |
| 2 to 4 | Yes | 19 | 88.8% | 98.4% | 69 |
| 5+ | No | 61 | 99.0% | 99.0% | 27 |
| 5+ | Yes | 11 | 86.2% | 92.1% | 100 |
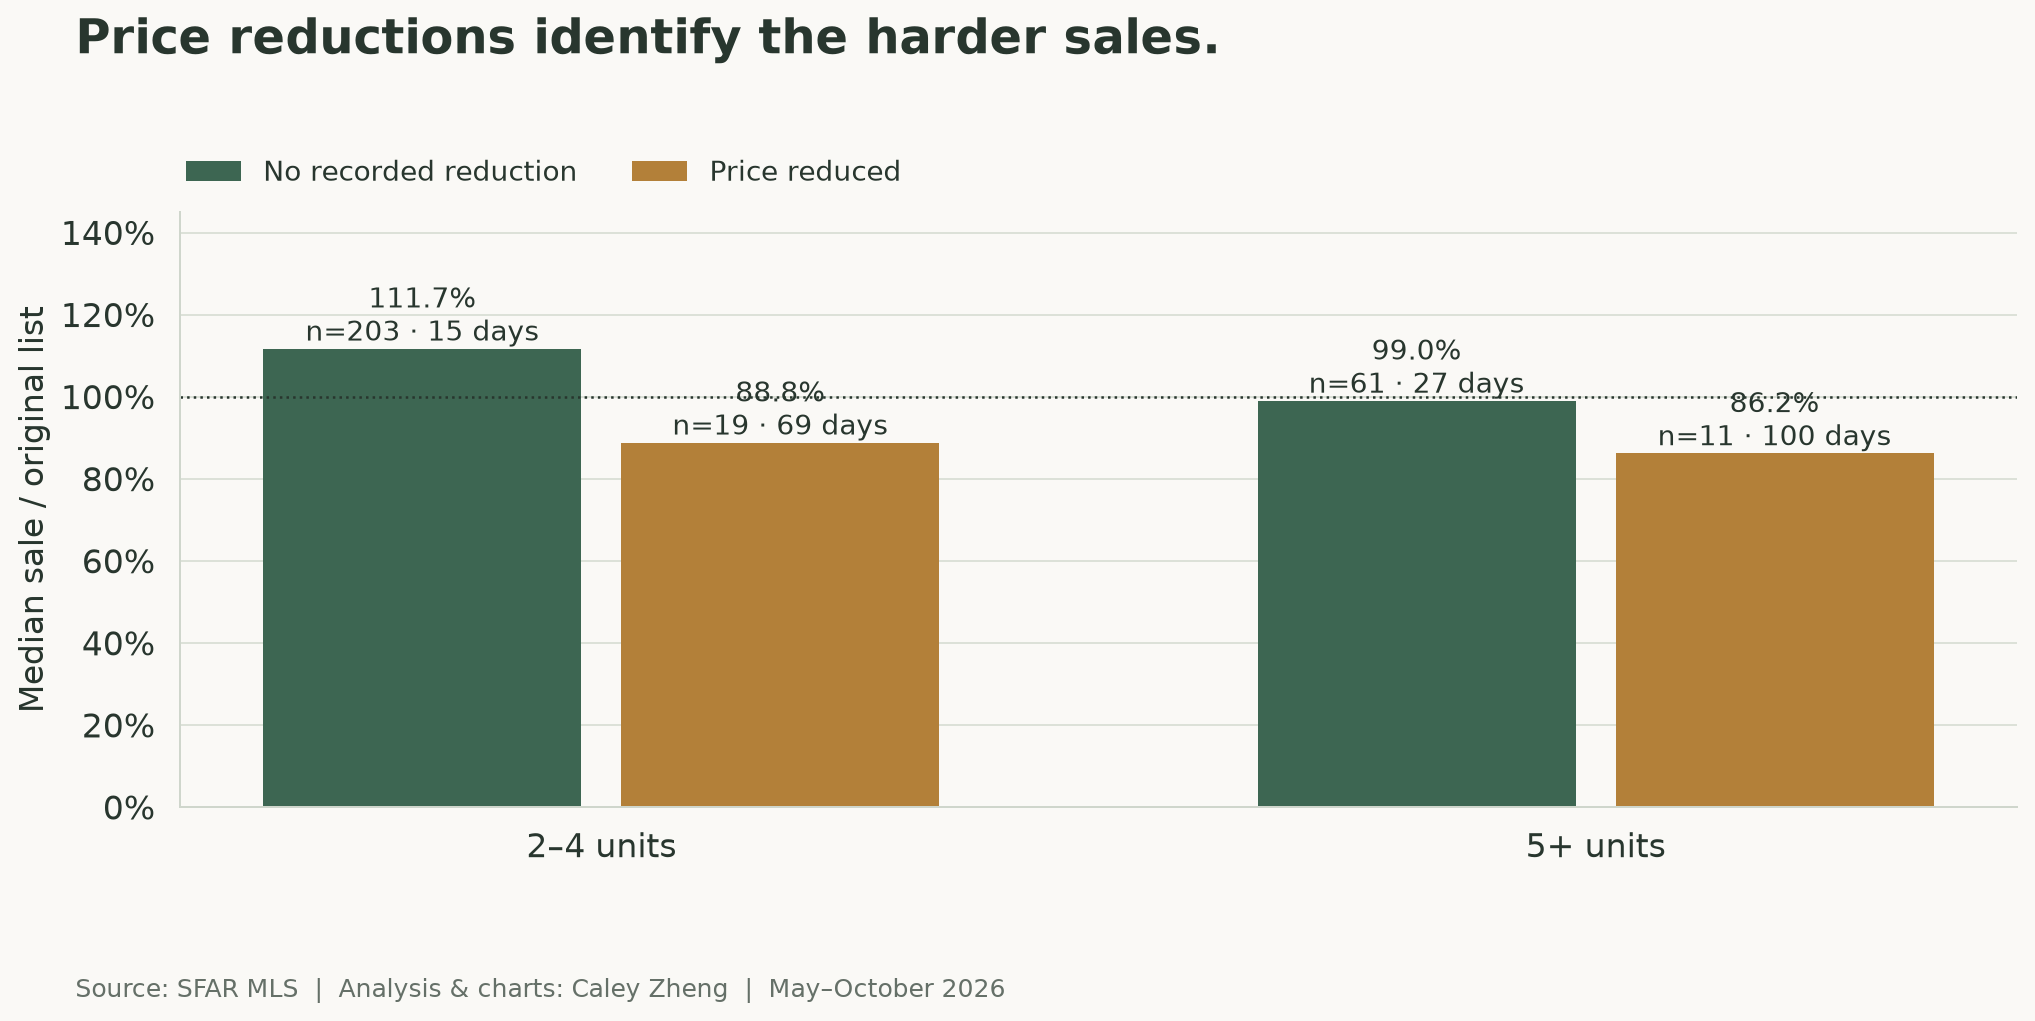
Small buildings with no recorded reduction closed at 111.7% of original list in 15 days. The reduced-price group landed at 88.8% in 69 days. For five-plus-unit buildings, the corresponding figures were 99.0% in 27 days and 86.2% in 100 days.
I read that as a warning to investigate why a listing is struggling, not evidence that cutting a price causes the entire discount. Condition, tenancy, initial expectations, and other differences can influence both the reduction and the result. This cut also covers 294 transactions rather than all 301, and it misses reductions achieved through withdrawal and relisting.
For a seller, I want the launch price grounded in relevant closed comparables and the likely buyer. For a buyer, I want the maximum price grounded in the actual building. “Twenty percent over asking” is a description of the negotiation, not a substitute for either analysis.
What I’m watching next
I am watching transaction count first. Does small-building activity recover after October’s 30 closings? Do larger buildings continue at roughly 11 or 12 sales a month? One November reading will add context; several months will tell a better story.
Alongside the closings, I am watching Treasury benchmarks, current lender spreads, coverage requirements, and rate-lock terms. October’s easing in longer-term yields may help new fixed-rate quotes if spreads hold, but any effect on completed sales can arrive later. A Fed decision, a loan quote, and a recorded closing happen on different clocks.
I also want active and pending inventory measured with the same property definitions. Closed sales tell me what cleared. They do not show every owner still waiting, every withdrawn listing, or the full set of choices a buyer has today. I would not declare a citywide buyer’s market from this closing sample alone.
For small-building buyers, my focus is possession, relevant comparables, and the value of the space they can actually use. For apartment buyers, it is the rent roll, verified expenses, financing, and the work required to own the building well. For sellers, it is identifying which of those buyers is most likely to show up.
My favorite part of multifamily is that it rewards curiosity. A second front door can mean a second income stream, a different ownership plan, or an entirely different buyer. The numbers help me figure out which conversation we should be having.
Have a building in mind? Let’s work through the numbers together.
Sources, definitions, and how I read the data
Property data: San Francisco Association of REALTORS® (SFAR) MLS. Rate benchmarks: Federal Reserve via FRED. Analysis, illustrations, and charts: Caley Zheng. Closing period: May 1–October 31, 2026; comparison period: May–October 2025. Research and data snapshot: November 3, 2026. This is Caley’s analysis, rather than an SFAR-authored market forecast.
The sample includes San Francisco Residential Income listings categorized as duplex, triplex, quadruplex, multifamily, apartment, or residential income, originating from SFAR. It excludes mixed-use properties, residential-income condos and townhouses, land, and listings originating in other MLS systems. The supplied monthly tables total 301 sales and 1,350 units. Comparisons with houses and condos use the corresponding SFAR sales summaries.
Unless labeled otherwise, prices, ratios, and marketing times are medians. Sale-to-list figures in this article use original asking price. The source excludes sale-to-list ratios outside 50%–200% and cap rates outside 1%–15%. Days on market is SFAR’s reported listing-level measure, used here as a proxy for time to contract; relisting can reset it. Closed-sale samples do not measure the probability that all listings will sell.
Occupancy categories come from keyword matches in listing remarks. Cap rates are agent reported, incomplete, and not an audited calculation of net operating income. Each chart includes its underlying table and CSV; subgroup sizes and narrower samples are shown where available. The raw transaction rows were not available for a new row-level audit.
The rate chart uses the final common nonmissing daily observation in each month for the Federal Reserve’s five-year DGS5 and ten-year DGS10 Treasury series. These national benchmark yields exclude mortgage spreads and are not observed San Francisco borrowing rates. The loan-sizing chart is a separate, hypothetical sensitivity model using monthly, fully amortizing payments; it holds price and cash flow fixed and does not reproduce a particular lender’s underwriting or predict a sale price.
Reconciliation notes
I used the numeric tables when their prose summaries conflicted. The top six geographic counts sum to 165 sales (54.8%). August, not October, has the highest all-multifamily monthly median price per unit. The July-to-October volume decline spans three consecutive monthly drops. The report’s four-unit discount example is not classified here as a five-plus-unit trade.
The report states that cap-rate fields exist on 196 sales, while its size-band table totals 184 cap-rate observations. I have not inferred why those counts differ or calculated a pooled cap rate. The price-cut table covers 222 small-building and 72 larger-building sales; its ratios are not imputed to the seven missing observations.