An extra 100 square feet of lot space in San Francisco is worth roughly $5,000 to $8,000, based on 2025–26 SFAR MLS sales comparisons. That is about $50 to $80 per square foot of additional land, compared with a median $1,095 per square foot of interior living space.
This is a pricing benchmark, not a quote for buying a separate strip of land. It translates observed premiums for substantially larger lots into a familiar unit. The next 100 square feet may be worth more or less depending on access, shape, slope, location and how you will use it.
What is the average lot size in San Francisco?
The average San Francisco single-family lot is 2,897 square feet, or about 2,900 square feet. The median is 2,683 square feet. The median better describes a typical lot because a few very large properties pull the average upward.
These SFAR MLS figures cover 12,585 single-family homes sold from 2020 through November 2026, counting each home once at its most recent sale. This distribution describes homes that sold, rather than every single-family parcel in the city.
| Measure | Lot size |
|---|---|
| Average | 2,897 sq ft |
| Median | 2,683 sq ft |
| Middle 50% of homes | 2,374 to 3,036 sq ft |
| 10th to 90th percentile | 1,751 to 3,999 sq ft |
San Francisco single-family lot sizes
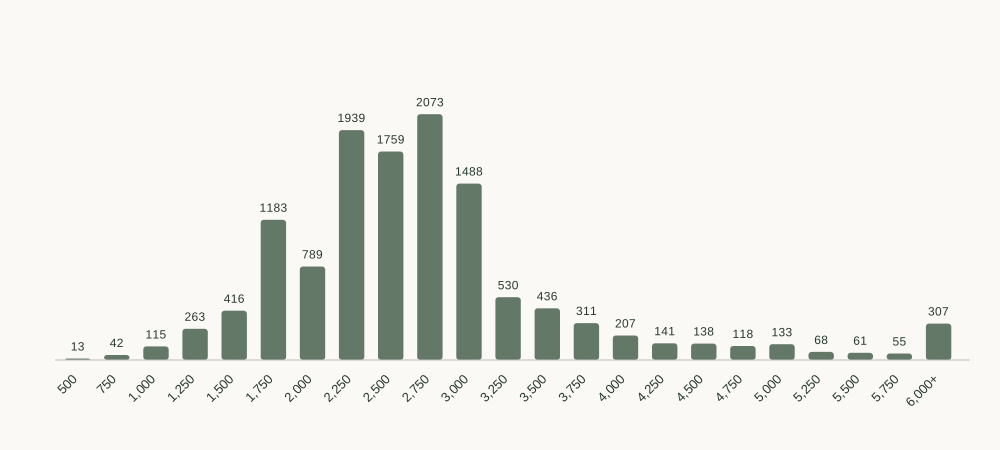
A classic 25-by-100-foot lot contains 2,500 square feet, slightly below the median. About 10% of homes in this dataset have lots of 4,000 square feet or more. The averages and percentiles come from the SFAR summary; the rounded 250-square-foot bins alone cannot reproduce exact statistics, particularly with an open-ended 6,000-plus bin.
View the lot size distribution
| Lot size (sq ft, 250-sq-ft bins) | Homes |
|---|---|
| 500 | 13 |
| 750 | 42 |
| 1,000 | 115 |
| 1,250 | 263 |
| 1,500 | 416 |
| 1,750 | 1183 |
| 2,000 | 789 |
| 2,250 | 1939 |
| 2,500 | 1759 |
| 2,750 | 2073 |
| 3,000 | 1488 |
| 3,250 | 530 |
| 3,500 | 436 |
| 3,750 | 311 |
| 4,000 | 207 |
| 4,250 | 141 |
| 4,500 | 138 |
| 4,750 | 118 |
| 5,000 | 133 |
| 5,250 | 68 |
| 5,500 | 61 |
| 5,750 | 55 |
| 6,000+ | 307 |
What does an extra 100 square feet cost?
The rough range is $5,000 to $8,000. For a buyer comparing two houses, that gives the following starting points.
| Additional lot area | Illustrative value at $50–$80 per sq ft |
|---|---|
| 100 sq ft | $5,000–$8,000 |
| 500 sq ft | $25,000–$40,000 |
| 1,000 sq ft | $50,000–$80,000 |
| 1,500 sq ft | $75,000–$120,000 |
Extra land: a rough $5,000 to $8,000 per 100 square feet
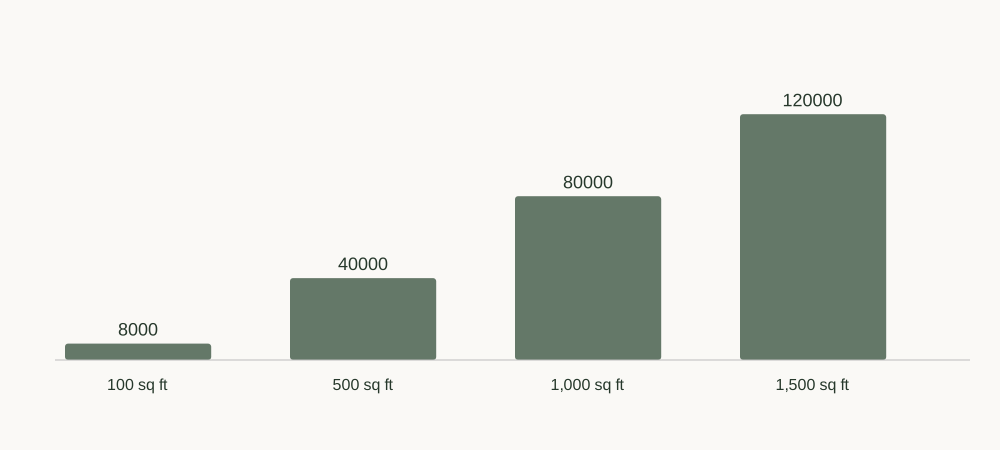
These figures are a sanity check. They are not a promise that each additional square foot carries the same value. A flat, accessible garden can be more useful than a steep rear slope, and a feasible building site requires its own analysis.
How do you separate the lot from the house?
Bigger lots often come with bigger houses. Comparing their sale prices without accounting for living space would overstate what buyers pay for land.
I compared 2025–26 sales within the same MLS district and the same 200-square-foot house-size band. On that basis, houses on 3,500 to 4,999 square foot lots sold for 6.5% more than houses on standard lots. Houses on lots of 5,000 square feet or more sold for 7.8% more. The largest-lot comparison includes 92 sales.
The table separates descriptive medians from the adjusted premium. The median sale prices below are not the matched comparison themselves.
| Lot size (sq ft) | Sales | Median lot (sq ft) | Median house (sq ft) | Median sale price | Adjusted premium | Sale / original list |
|---|---|---|---|---|---|---|
| Under 2,000 | 462 | 1,751 | 1,500 | $1,545,000 | +0.7% | 118.7% |
| 2,000–2,699 (standard) | 1043 | 2,496 | 1,585 | $1,518,000 | 0.0% | 116.9% |
| 2,700–3,499 | 999 | 2,997 | 1,851 | $1,970,000 | +3.9% | 122.6% |
| 3,500–4,999 | 292 | 3,999 | 2,188 | $2,309,330 | +6.5% | 119.1% |
| 5,000+ | 92 | 5,511 | 2,315 | $2,450,000 | +7.8% | 111.0% |
The larger-lot houses had a median 2,315 square feet of living space, versus 1,585 on standard lots. That helps explain why the raw median sale price is so much higher even though the adjusted lot premium is about 8%.
Using the 2025–26 median price of $1,866,500, a 6.5% premium is about $121,000. Divided by approximately 1,500 additional square feet of land, that is about $81 per square foot. A 7.8% premium is about $146,000. Divided by roughly 3,000 additional square feet, it is about $49 per square foot. Rounded, those comparisons produce the $50 to $80 benchmark.
Oversized lots also did not have the largest overbids in these summaries. The 5,000-plus group sold at a median 111% of original asking, compared with 116.9% for standard lots. Asking-price strategy and property condition affect that ratio, so it does not establish that lot size causes weaker competition.
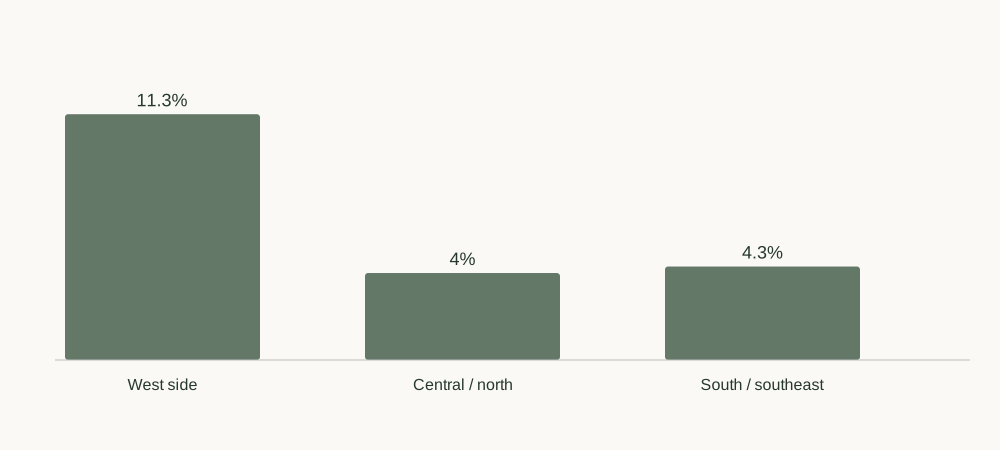
Where does additional lot space command the biggest premium?
The west side showed the strongest association between lot size and price. From 2023 through November 2026, doubling lot size was associated with about an 11% premium in the Sunset, Richmond, West of Twin Peaks and nearby districts.
The central and northern districts showed premiums of about 3% to 4%. Estimates in the south and southeast ranged from about 2% to 4%, depending on how tightly location was controlled.
Lot premiums vary across San Francisco
| Area | Sales | District control | Approximately 1 km grid control |
|---|---|---|---|
| West side | 2560 | 11.3% | 11.1% |
| Central and north | 802 | 4.0% | 3.2% |
| South and southeast | 2079 | 4.3% | 1.6% |
| All San Francisco | 5441 | 7.7% | 6.1% |
The grid comparison checks whether the result survives a more local location adjustment. The west-side estimate barely changes; the southern estimate changes more. That is a reason to use local comparables before applying a citywide benchmark to a particular house.
Did the Family Zoning Plan make larger lots more valuable?
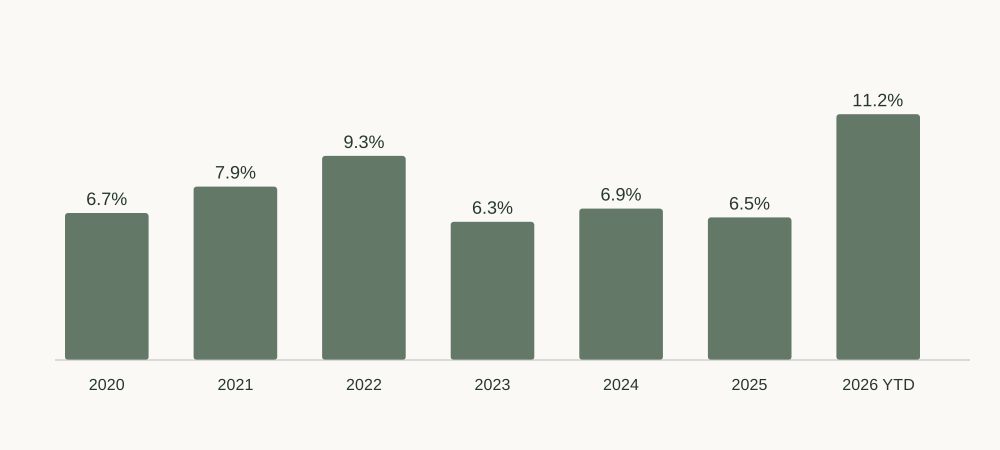
The annual model estimate for doubling lot size rose from 6.5% in 2025 to 11.2% in 2026. From 2020 through 2025 it ranged from 6.3% to 9.3%.
The San Francisco Planning Department reports that the Family Zoning Plan was signed into law on December 12, 2025. The timing makes the increase worth watching, but these comparisons cannot isolate the plan’s effect.
Estimated premium for doubling lot size
| Year | Sales in annual model | Estimated doubled-lot premium |
|---|---|---|
| 2020 | 1483 | 6.7% |
| 2021 | 1975 | 7.9% |
| 2022 | 1510 | 9.3% |
| 2023 | 1112 | 6.3% |
| 2024 | 1385 | 6.9% |
| 2025 | 1589 | 6.5% |
| 2026 YTD | 1355 | 11.2% |
One year does not establish a trend. The estimate also rose in 2022 before falling in 2023. Differences in the homes sold, unrecorded property features and other market changes could contribute to the 2026 increase. Development potential should be evaluated parcel by parcel.
What should buyers and sellers do with these numbers?
For buyers
Start with houses of similar size, condition and location. Use $5,000 to $8,000 per additional 100 square feet as an initial check on the lot premium. Pay attention to whether that space is usable and whether your household will enjoy it.
If the asking price depends on an ADU, a lot split or more housing, obtain a parcel-specific feasibility review and a construction estimate before paying for that potential. Start with the renovation permits guide.
For sellers and owners
Explain what makes the extra land useful. A usable yard, documented access or a professionally evaluated development plan gives buyers something concrete to assess. Avoid pricing outdoor square footage as though it were finished living space.
If you plan to build, compare the project’s full cost with its likely income or resale value. The investor learning center covers cash flow, operating expenses and due diligence.
Estimate the value of extra lot space
Enter the additional land you are comparing. This tool applies the citywide $50 to $80 per square foot benchmark. It does not assess zoning, buildability or property-specific differences.
100 extra square feet: approximately $5,000 to $8,000.
Formula: additional square feet × $50 to $80. Use local comparables to refine the estimate.
My take
I would pay more for extra land when it serves a specific purpose: a yard the family will use, an ADU with a realistic budget, or a development plan checked against the parcel’s constraints. Otherwise, the house’s size, condition and location remain the starting point.
An oversized lot has value. The SFAR comparisons suggest that value is usually a modest share of the whole property price. Treat the $5,000 to $8,000 per 100 square feet as a useful first question, then investigate what makes the particular property different.
Frequently asked questions
What is the average single-family lot size in San Francisco?
The SFAR summary of 12,585 distinct homes sold from 2020 through November 2026 gives an average of 2,897 square feet and a median of 2,683 square feet.
How much is an extra 100 square feet of land worth?
Roughly $5,000 to $8,000 in the 2025–26 comparisons. This is a translation of larger-lot premiums, not a separately measured premium for each 100-square-foot increment.
Is lot square footage worth the same as living space?
No. The extra-land benchmark is roughly $50 to $80 per square foot, compared with a median $1,095 per square foot of living space. Interior price per square foot includes the value of the entire property and should not be read as a construction-cost estimate.
Is a bigger lot always worth more?
Usability, location and feasible development options matter. The comparisons describe an association across sales, not a guaranteed premium for every property.
Methodology and sources
Source: SFAR MLS single-family closed-sale summaries for San Francisco, January 2020 through November 16, 2026. The lot distribution is a separate summary of 12,585 distinct homes, counted once at their most recent sale. Its exact average and percentiles come from that summary, not from estimates using the rounded bins.
The price-premium analysis excludes future close dates, prices below $100,000, living area outside 500 to 6,000 square feet, lots outside 800 to 20,000 square feet, missing districts, and the top and bottom 1% of price per square foot in each year. The 2025–26 band comparisons use log prices within district and 200-square-foot house-size bands. Annual and regional figures use log-price models of house and lot size, with district or approximately one-kilometer grid location controls. These are different comparisons with the sample counts shown in their tables.
The estimates are observational. Lot size can travel with light, slope, frontage, parking, views and condition that are not fully recorded in the MLS. No confidence intervals were provided in the summary, and the 5,000-plus headline group contains 92 sales. The findings do not establish a causal return from adding land or building on it.
Additional context: San Francisco Association of REALTORS® and SF Planning’s Family Zoning Plan, checked November 17, 2026.
Have a house or a lot in mind? Let’s work through the numbers together.
Working through a TIC decision? The TIC learning center connects the ownership, financing, costs, and buyer-diligence guides.